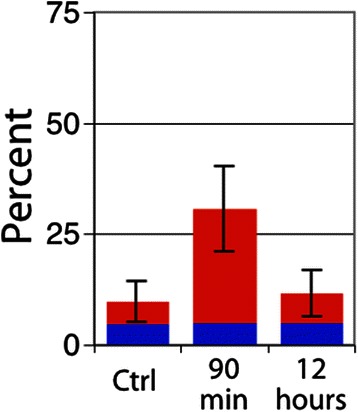
Fig. 9.

Percent tissue area exhibiting gross vascular shutdown. Regions of shutdown and necrosis were identified as a fraction of whole tissue area. Percent tumor area in U87 tumors that is necrotic (blue square) or unperfused (red square). Error bars depict ±SD, N = 6 for each group (p < 0.05 between control and 90 min for unperfused area, other data not significant)
