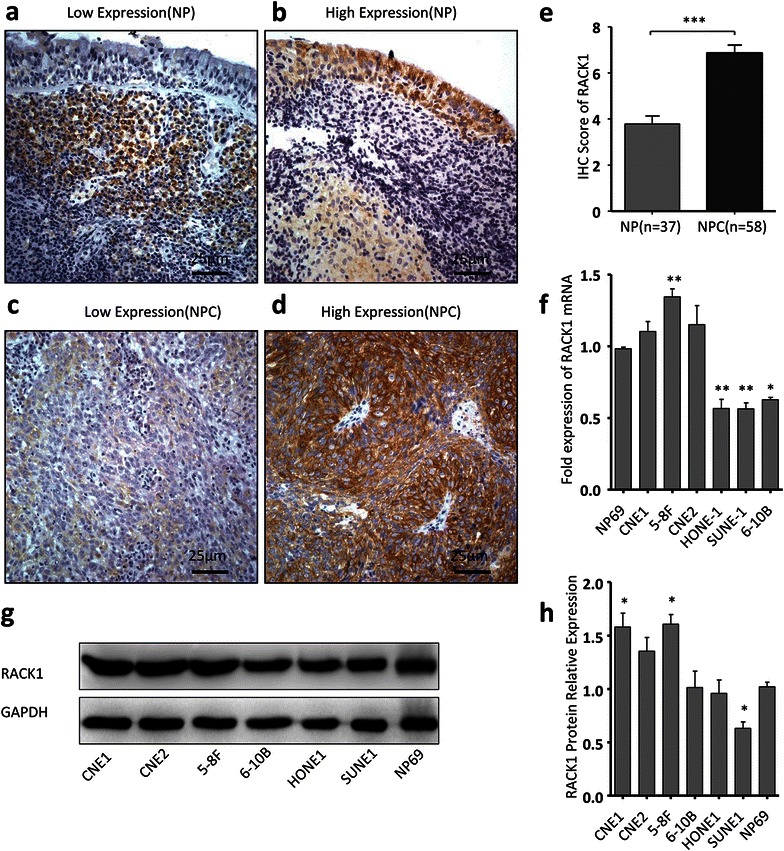
Fig. 1.

The expression of RACK1 in NPC tissues and cells. a–d The expression of RACK1 was evaluated by immunohistochemistry in NPC and NP tissues. Original magnification, ×400; scale bar 25 μm. e The histogram shows the difference of RACK1 expression (IHC score) in NPC tissues and NP tissues. Student’s t test. f The relative expression levels of RACK1 mRNA in NPC cells and NP69 determined by qRT-PCR, quantified by relating to GAPDH. One-way ANOVA and Dunnett’s multiple comparison tests. g, h RACK1 protein expressions in NPC cells and NP69 were measured by Western blot. One-way ANOVA and Dunnett’s multiple comparison test. Mean ± sem, N = 3, *P < 0.01, **P < 0.01, ***P < 0.001
