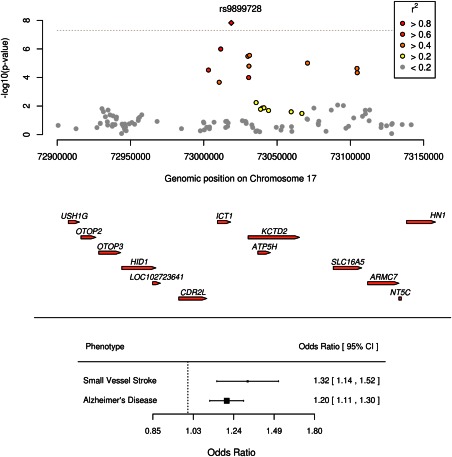
Figure 2.

Association of ATP5H/KCTD2 locus with AD and SVD by genomic position and forest plot showing effect of risk SNP on SVD and AD with 95% CIs. AD = Alzheimer's disease; CI = confidence interval; SNP = single‐nucleotide polymorphism; SVD = small vessel disease. [Color figure can be viewed in the online issue, which is available at www.annalsofneurology.org.]
