
Figure 1.
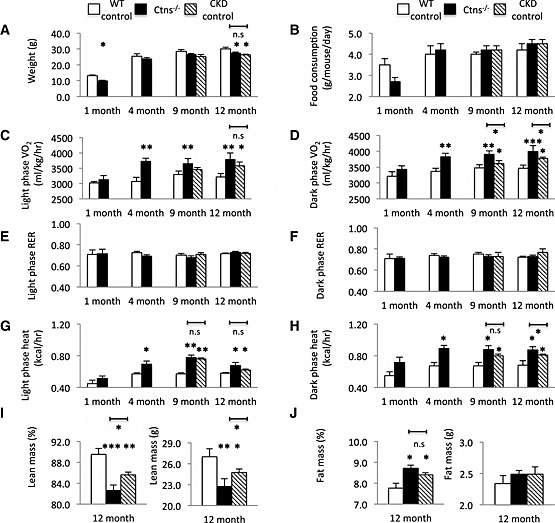
Energy homeostasis and body composition in Ctns−/− mice. Body mass (A) and food consumption (B); resting metabolic rate (VO2) of light and dark phase (C and D); light and dark phase respiratory exchange ratio (RER) (E and F); and light and dark phase energy expenditure (G and H). Mice were scanned by quantitative magnetic resonance (QMR) at 12 months of age. Percentage of lean mass, total lean mass, percentage of fat mass, and total fat mass (I and J). Number of mice is ≥8 in each group. Data are expressed as mean ± standard error of the mean. *P < 0.05, **P < 0.01, ***P < 0.001.