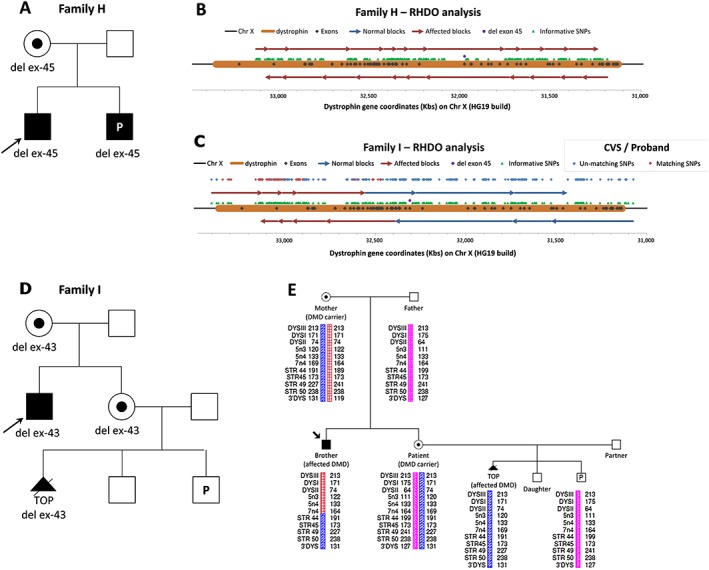
Figure 4.

(A) Family tree of family H. (B) Diagram of relative haplotype dosage (RHDO) analysis results for family H, showing the chromosome position of the dystrophin gene, its exons, the informative SNPs identified and the mutation. Haplotype blocks are represented as red and blue arrows depending on whether they show an overrepresentation (red) or under‐representation (blue) of the affected haplotype. (C) Diagram of RHDO analysis results for family I. The switch from over‐representation to under‐representation of the affected haplotype indicates that a recombination event has taken place. The comparison between SNP alleles sequenced from the chorionic villus sampling (CVS) and the proband DNA samples is represented in the diagram by blue dots where unmatching alleles were observed and by red dots where matching alleles were found. (D) Family tree of family I. (E) Linkage analysis on family members of family I using Duchenne muscular dystrophy (DMD) markers. The marker name and size for both alleles are shown along the dystrophin gene region under each family member tested
