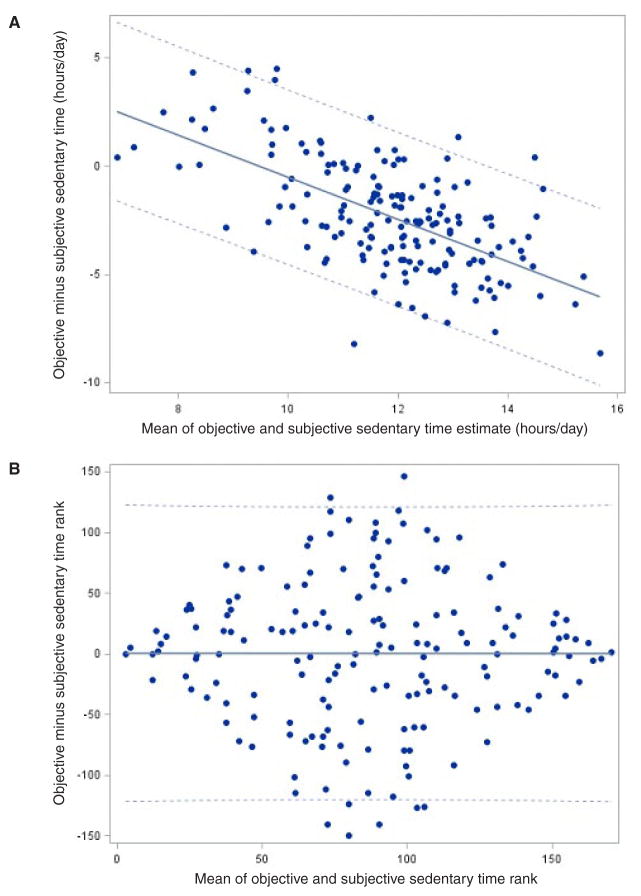
Figure 3.
A. Modified Bland-Altman plot of objective accelerometer-derived sedentary time and subjective continuous YPAS-derived sedentary time differences (n = 172). Note. Solid line: estimate of slope = −0.97 (95% CI: −1.16 to −0.78). Dashed lines: limits of agreement = mean difference ± 4.0 hours/day. B. Modified Bland-Altman plot of objective rank order and YPAS-derived continuous estimate rank order (n = 172). Note. Solid line: estimate of slope = −0.00097 (95% CI: −0.23 to 0.23). Dashed lines: limits of agreement = mean difference ± 121.

