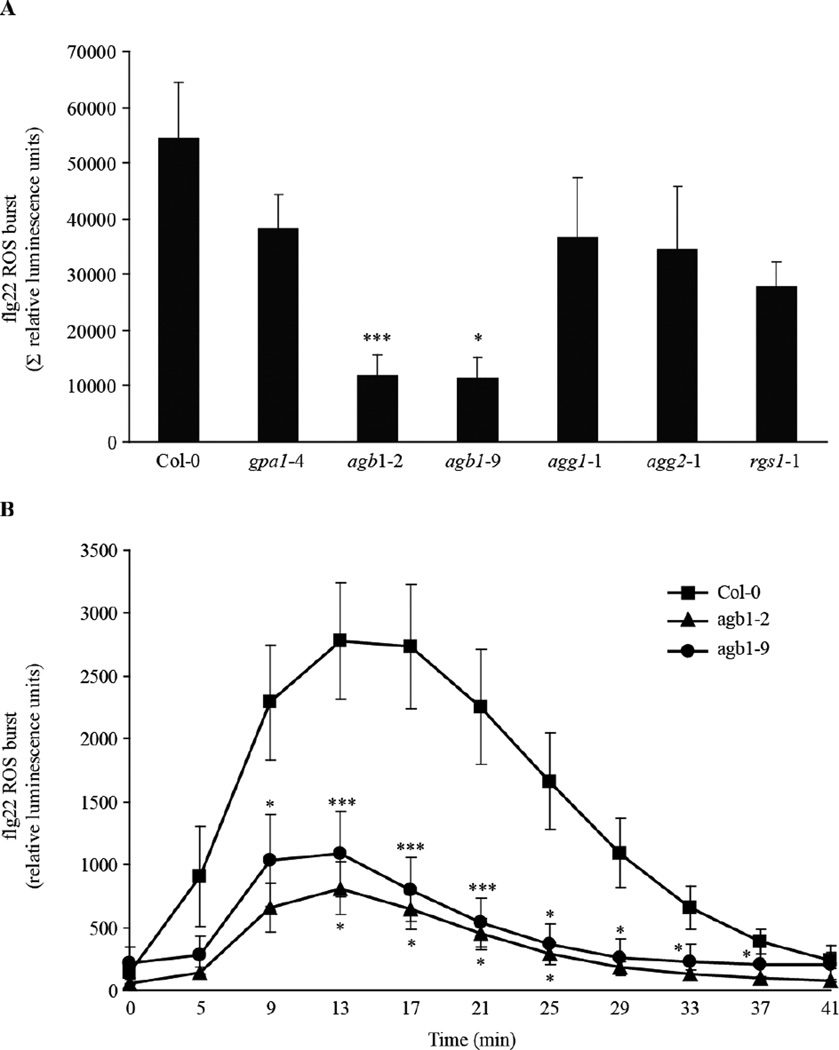
Figure 4.
Flg22-induced ROS burst in G-protein single mutants. Leaf discs from 4-week old plants were treated with 1 µM flg22 and ROS formation was measured in a chemiluminescence assay. (A) Flg22-induced ROS production in the indicated genotypes is represented as the integrated area under the ROS curve measured during a time course of 41 min and is referred to as Σ relative luminescence units. (B) ROS burst in the indicated genotypes was measured for the indicated time points after flg22 application. Results are presented as mean ± SE of at least five independent experiments. Asterisks indicate a significant difference from Col-0 wild-type (*** P < 0.01, * < 0.05, Student’s t-test).

