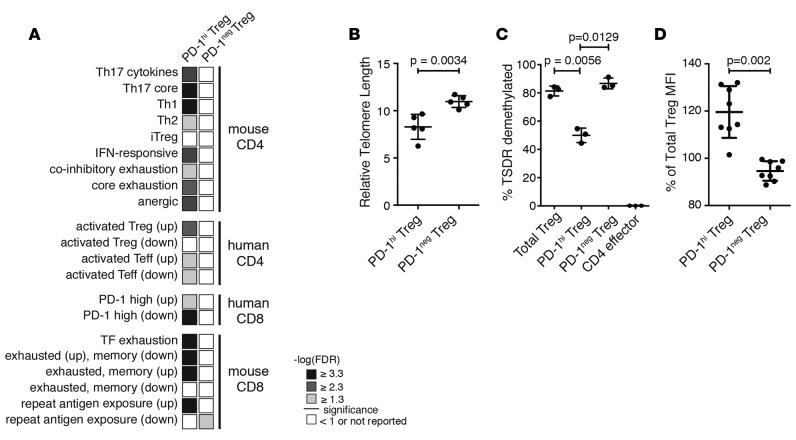
Figure 3. Programmed cell death protein 1 (PD-1)hi Tregs display shorter telomeres and may be clonally exhausted.
(A) Gene set enrichment analysis of RNA-sequencing data with exhaustion signatures derived from the literature. The FDR for PD-1hi and PD-1– Treg populations (n = 3 each) is shown. (B) Relative telomere length (mean ± SD) assessed by flow cytometry ex vivo in sorted Tregs in 5 individuals (Student’s paired t test). (C) Percentage of telomere-specific demethylated region (TSDR) demethylation (mean ± SD) assessed ex vivo in sorted Tregs and T effector cells in 3 individuals (1-way ANOVA with Tukey’s multiple comparisons test). (D) FoxP3 expression intensity (mean ± SD) in sorted PD-1hi and PD-1– Tregs ex vivo, relative to the total Treg population from 8 individuals (Student’s t test).

