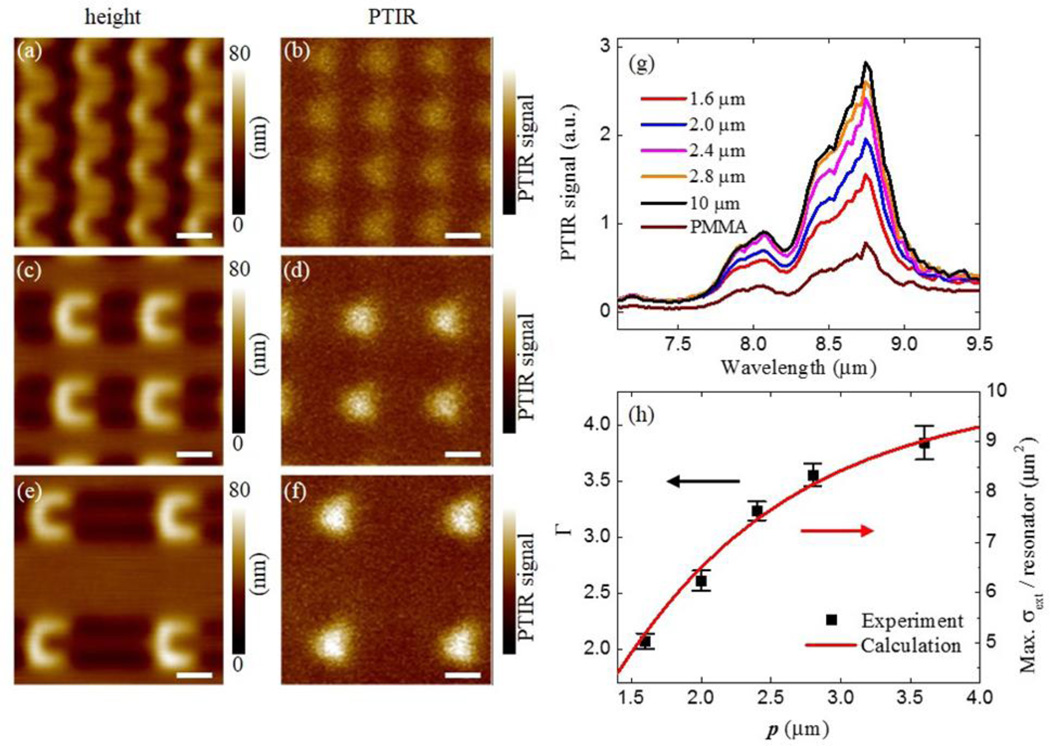
Figure 6.
(a)–(f) Height (left column) and PTIR (right column) images in U-SRR arrays with pitches of 1.6 µm (a, b), 2.4 µm (c, d) and 3.6 µm (e, f). PTIR images were obtained at 8.75 µm (1142 cm−1). PTIR images are displayed with same intensity scale and all scale bars are 1 µm. (g) PTIR spectra in U-SRR arrays with different pitches measured at hot-spot location and in the bare PMMA film away from the resonators. (h) Comparison between PTIR enhancement factors (Γ) for the near-field hotspots at 8.75 µm and theoretical calculation of extinction cross section per resonator from Figure 5b. The uncertainty in enhancement factor represent a single standard deviation in the measurement of the PTIR spectral intensity ratio with respect to the PMMA reference.

