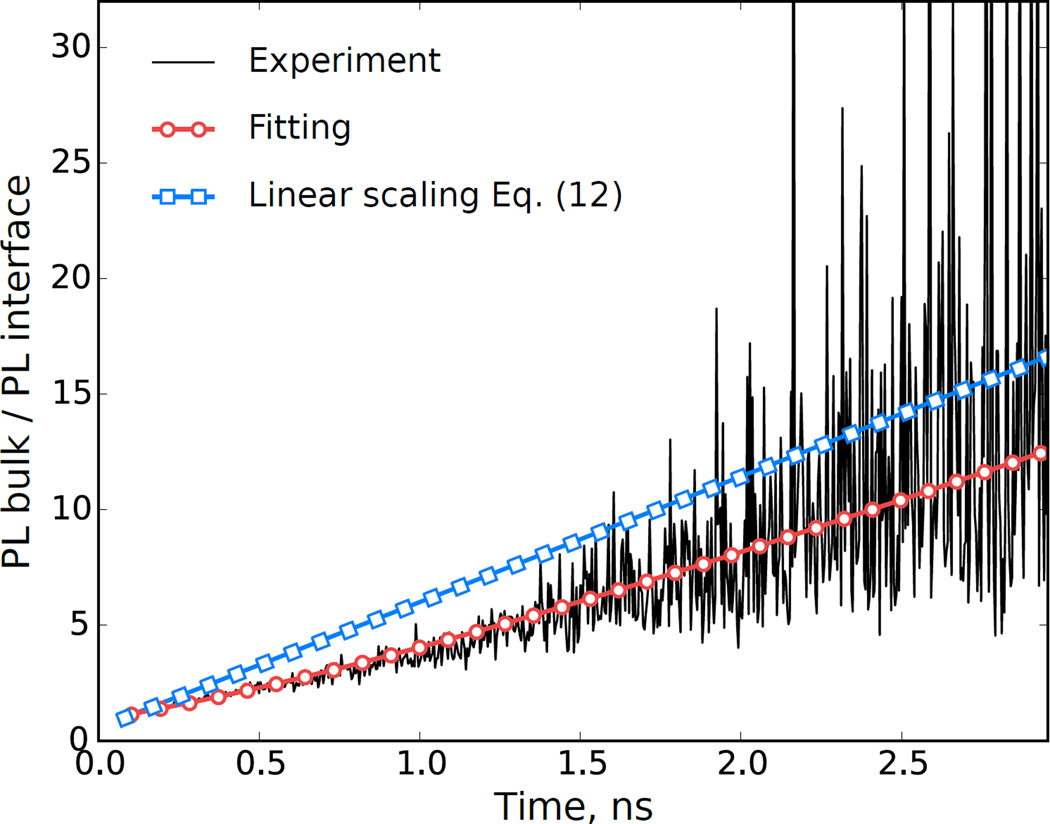
FIG. 4.
Ratio of bulk and interface photoluminescence intensities as a function of time. The black (red-white dotted) continuous line corresponds to the ratio of the experimental (numerical) data presented in Fig. 3 The blue line with square symbols corresponds to Eq. (13) with the parameters used in Fig. 3.

