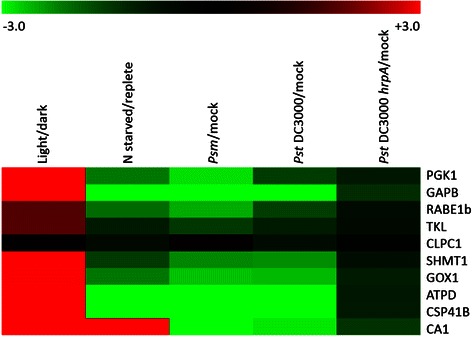
Fig. 4.

Gene expression profiling of the expression correlated cyclic nucleotide binding protein candidates. Heat map to show that the ten expression correlated CNBP candidates (extracted from Table 3) are co-expressed and differentially expressed in the selected microarray experiments. Experiments chosen were light vs. dark grown seven day old seedlings; seven day old seedlings that were shifted to nitrogen starved vs. replete media for a further 48 h; Col-0 infected with 105 cfu cm−2 virulent Psm ES4326 for 24 h vs. mock infected; Col-0 infected with 108 cfu cm−2 virulent Pst DC3000 or 108 cfu cm−2 Pst DC3000 hrpA mutant (lacks the type III protein secretion system that delivers virulence effector proteins into host cells) for 7 h vs. mock infected. The scale bar shows the intensity of the log2 transformed fold change values used to generate the heat map
