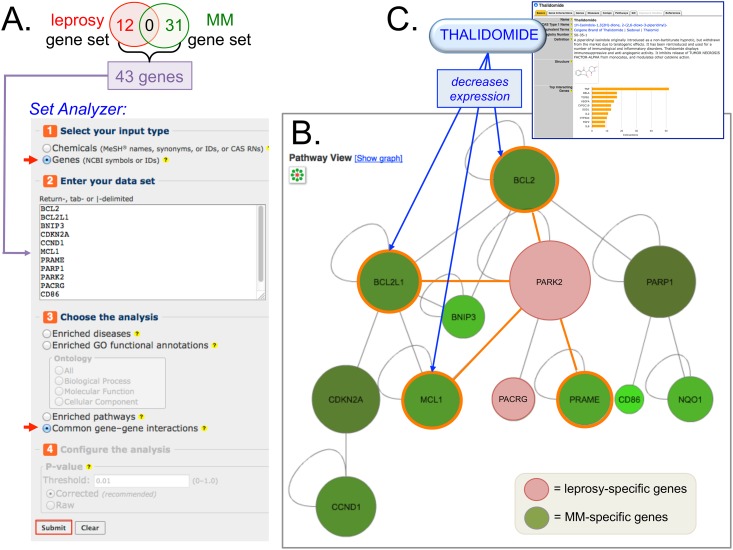
Fig 7. Leveraging CTD content to build a molecular nexus.
(A) Leprosy and multiple myeloma (MM) are both treated by the drug thalidomide, but the diseases do not currently share any genes in CTD. CTD’s Set Analyzer tool can be used to determine whether the disease-specific gene sets function in a common pathway by: selecting “Genes” (top arrowhead), entering the non-overlapping 43 gene symbols for the two diseases, and then selecting “common gene-gene interactions” (bottom arrowhead). (B) The resulting interaction network can be customized as a graph using the “Pathway View” icon; genes are displayed as circles and their genetic interactions are represented as gray lines. Here, the graph reveals that one leprosy-specific gene (PARK2; red circle) physically interacts with four MM-specific genes (BCL2, BCL2L1, MCL1, and PRAME; green circles with orange borders). Note: for simplicity, only the relevant genes are shown in the interaction network. (C) Leveraging the curated chemical-gene interactions found on CTD’s page for “Thalidomide” (upper right-hand screenshot) reveals that the drug decreases the expression (blue arrows) of three of the genes (BCL2, BCL2L1, and MCL1) that interact with the leprosy-specific PARK2.

