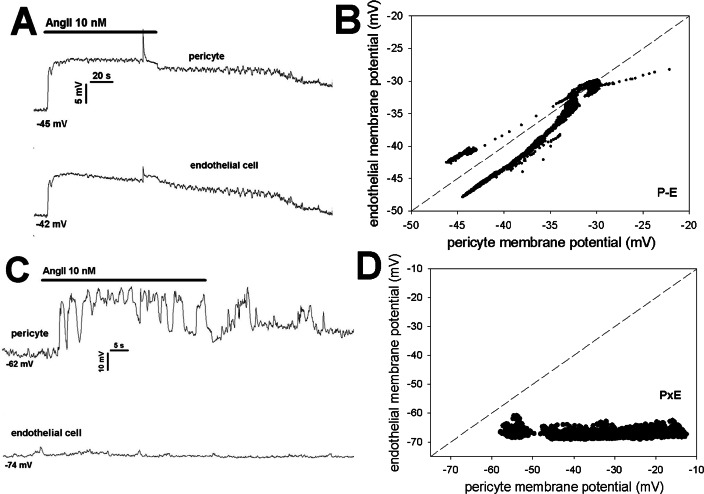
Fig 8. Simultaneous pericyte, endothelial membrane potential responses to AngII with and without cell contact.
A. Example of AngII induced membrane potential responses of a pericyte and an endothelial cell physically associated with one another along the DVR wall (as in Fig 5A). Similar time dependent variations persisted throughout the record. Resting potentials prior to AngII were -45 mV and -42 mV. B. Individual data points of the record in panel A are shown superimposed upon the line of identity. Throughout most of the record, the endothelium remained hyperpolarized relative to the pericyte. C. Example of AngII induced membrane potential responses of a pericyte and an endothelial cell when cells were dissociated (as in Fig 5B). Membrane potential variations were observed in the pericyte but not in the endothelial cell. Resting potentials prior to AngII were -62 mV and -74 mV. B. Individual data points of panel A are shown superimposed upon the line of identity. Pericyte response occurred but a concomitant endothelial response was absent.

