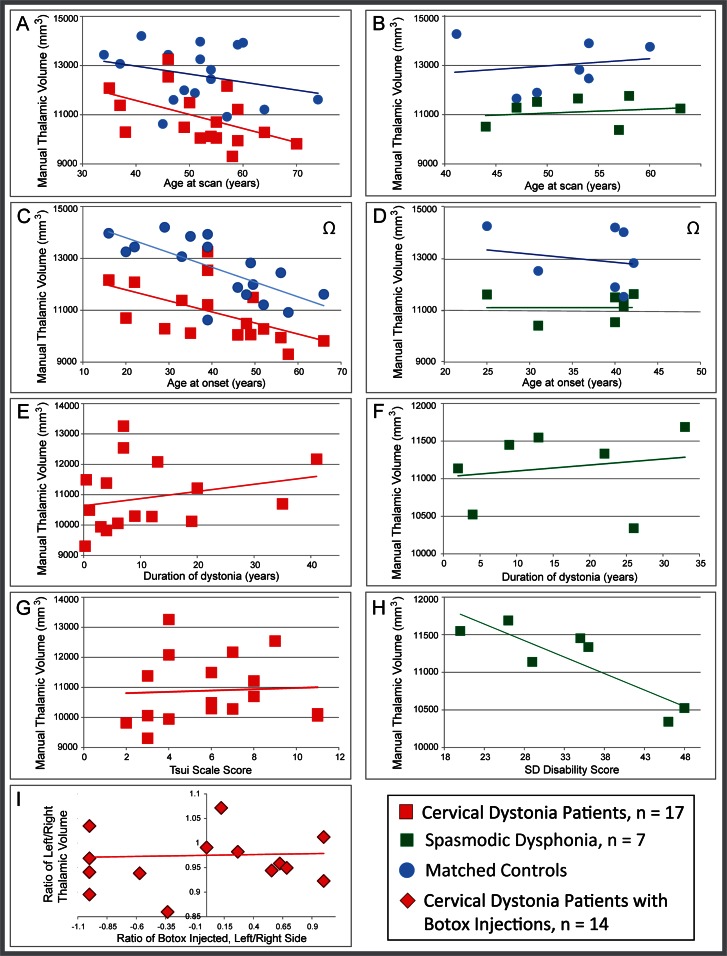
Fig 5. Relationship of clinical measures to gross thalamic volume in CD patients.
The relationship between individual gross thalamic volume (manually segmented, in mm3) and clinical measures suggests that reduced gross thalamic volume is a risk factor for dystonia, and is not a secondary effect of dystonia symptoms. Data are shown for all variables, even if excluded from regression models, so raw data for CD and SD can be viewed and compared. Both CD patients and controls (A) showed declining volume with age. Patient:control gross thalamic volume showed a qualitative divergence with age between CD and controls, but the divergence was not statistically significant. (B) There was no relationship between volume and age in the SD cohort (for either SD or controls), presumably reflecting the smaller age range in this cohort. Likewise, there was no divergence of slopes with age between SD and controls. Age at CD onset (C) appeared to correlate with gross thalamic volume, but this was likely driven by the relationship between age at scan and age of onset; age at SD onset (D) was not correlated with volume. Gross thalamic volume did not correlate significantly with duration for either CD (E); this relationship was not evaluated statistically for SD due to collinearity with other variables, but the positive slope suggests no indication of a decline in volume with increasing duration (F). Thalamic volume also did not correlate with severity of dystonia for either CD or SD in the multiple regression model, as measured by the Tsui scale for CD (G) or the voice-related quality of life score for SD (H), although the SD relationship to severity showed a trend toward significance (V-RQOL, p = 0.056), and appeared significant when evaluated post hoc as a single variable (p = 0.012). The asymmetry of muscles affected with cervical dystonia (as gauged by laterality of units of botulinum toxin injected) did not correlate with asymmetries in thalamic volume (I, p = 0.89). Note that for (C) and (D), thalamic volumes for control subjects are plotted vs. the age at onset for the matched patient, as control subjects do not have an age at onset. Volume for control subjects is included in C and D as a reference only (designated by Ω), to illustrate that patient:control differences persist (and in fact are more robust) when demographics (including age) are matched: with the exception of a single CD/control dyad, every patient showed lower volume than his/her matched control.

