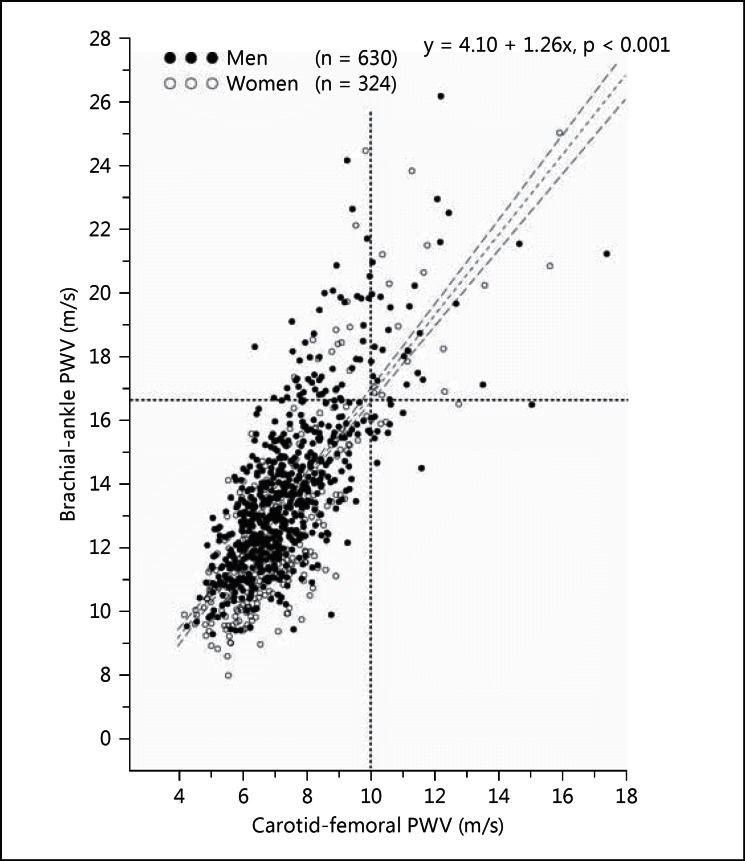
Fig. 1.
Scatter plot for the interrelationship between brachial-ankle and carotid-femoral PWV. Dots and circles represent men and women, respectively. The dashed vertical lines indicate the diagnostic threshold for arterial stiffness for brachial-ankle (16.7 m/s) and carotid femoral PWV (10 m/s), respectively. The regression line was drawn with 95% confidence limits. The regression equation and the corresponding p value for the slope are given.

