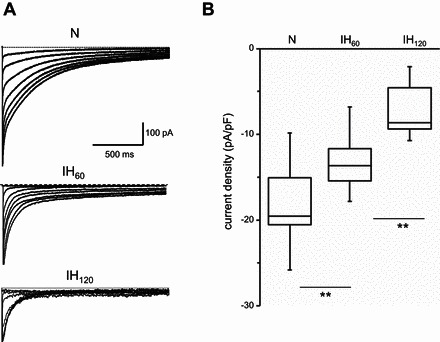
Fig. 2.

Effect of IH on hERG K+ conductance. A: representative whole cell currents recorded from SH-SY5Y cells grown in normoxia and in cells exposed to IH60 and IH120. B: HERG K+ current density was calculated by normalizing average peak tail current amplitude measured at −90 mV to cell capacitance (pA/pF) from cells exposed to normoxia (n = 15 cells), IH60 (n = 11 cells), and IH120 (n = 17 cells). To give a measure of data dispersion, data are presented in box charts, whiskers making the 5th and 95th percentile and the box determining the 25th and 75th percentile. Median is represented by the line in the boxes. **P < 0.01.
