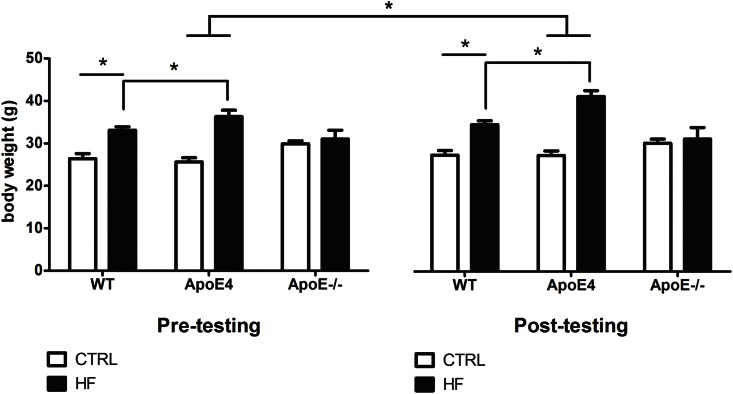
Fig 2. Body weight during the experimental phase.
HF diet increased body weight pre- and post-testing in both ApoE4 (p<0.001) and WT (p<0.001) mice compared to CTRL diet, but not in ApoE-/-. Furthermore, the body weight increase due to HF diet was significantly stronger in ApoE4 compared to WT (p = 0.002). Values represent mean±SEM; WT CTRL n = 8, WT HF n = 8, ApoE4 CTRL n = 8, ApoE4 HF n = 8, ApoE-/- CTRL n = 5, ApoE-/- HF n = 6. *p≤0.05. ApoE = apolipoprotein E; CTRL = control; HF = high-fat; WT = wild-type.

