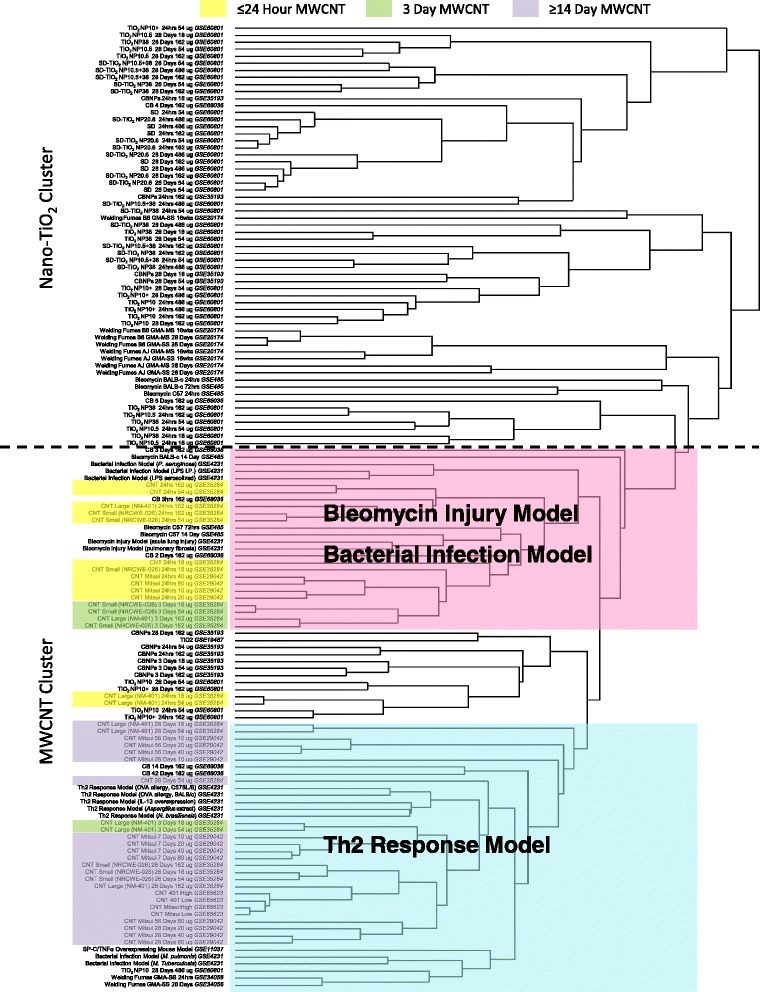
Fig. 1.

NanoTiO 2 and MWCNTs clustered separately, and MWCNTs were further differentiated by the post-exposure time period. Hierarchical clustering was used to visualize the differential expression of 2334 common genes across the microarray platforms used in this study and across 137 different experimental conditions from 12 studies. The figure depicts the clustering of individual arrays performed on RNA isolated from murine lung tissue within each respective study. Two distinct clusters were identified, with nanoTiO2 arrays and MWCNT arrays clustering separately. The MWCNT cluster could be further divided into two sub-clusters: (1) arrays from MWCNT exposure models were correlated with those from bacteria and bleomycin exposure models (pink); and (2) expression profiles from MWCNT exposure models were correlated with arrays from a Th2 model (blue). Other nanomaterial exposure models did not cluster in notable patterns
