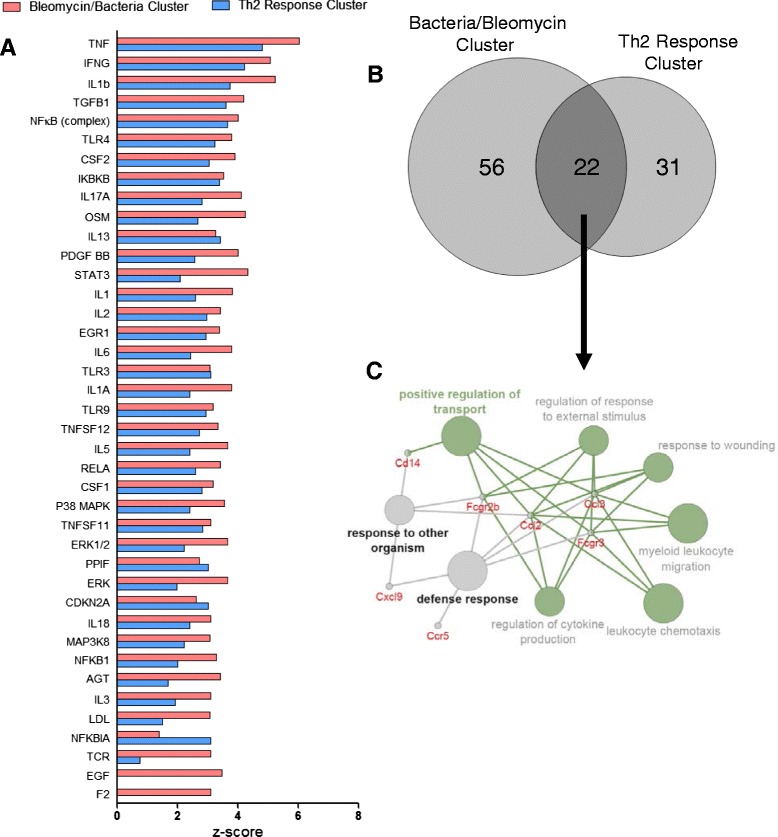
Fig. 4.

Upstream regulator analysis identifies inflammatory mediators similar to both clusters. a IPA software was used to identify the upstream regulators of the gene expression profile of the pink and blue clusters. b A Venn diagram was constructed to investigate the similarity between the genes that were increased in each of the shortlists, demonstrating the overlap between them. c The Cytoscape apps ClueGO and CluePedia created a visual network of the biological functions enriched in these overlapping genes and identified specific genes that are common to different biological functions. All but two of the GOs were grouped together based on similar gene expression patterns and are highlighted in green, with the positive regulation of transport GO being the most significantly enriched biological function in the group
