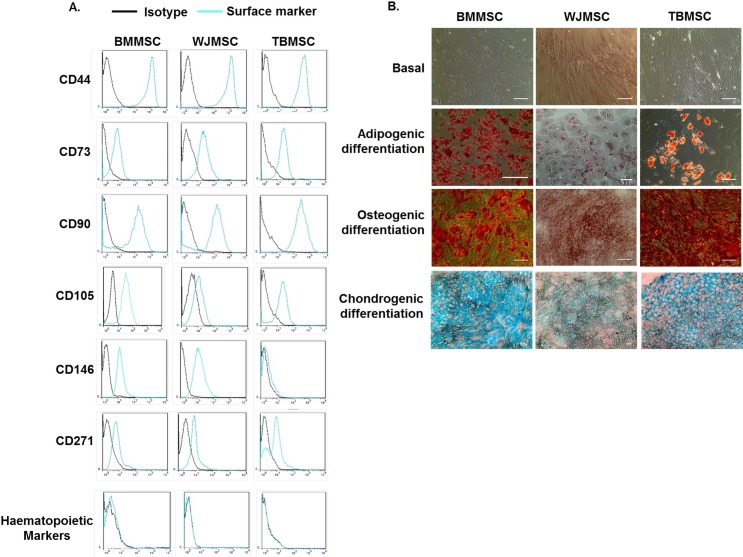
Fig 1. Characterisation of MSC isolated from different tissue sources.
(A) Expression of MSC markers CD44, CD73, CD90, CD105, CD146, CD271 and combined expression of the haematopoietic markers CD14, CD20, CD34 and CD45 by BMMSC, WJMSC, or TBMSC by flow cytometry. Data are expressed as representative histograms compared to isotype controls and are representative of n = 3 independent experiments using 3 different MSC donors. (B) BMMSC, WJMSC, and TBMSC were differentiated towards osteoblast, adipocyte, or chrondocyte lineage for 14 or 21 days. Adipogenic, osteogenic and chrondogenic differentiation were assessed using Oil Red O, Alizarin Red or Alcian Blue to stain lipid droplets, calcium deposits or cartilage specific proteoglycans respectively. Phase contrast and colour micrographs are representative of n = 3 independent experiments using 3 different MSC donors. Scale bar represents 10μm.

