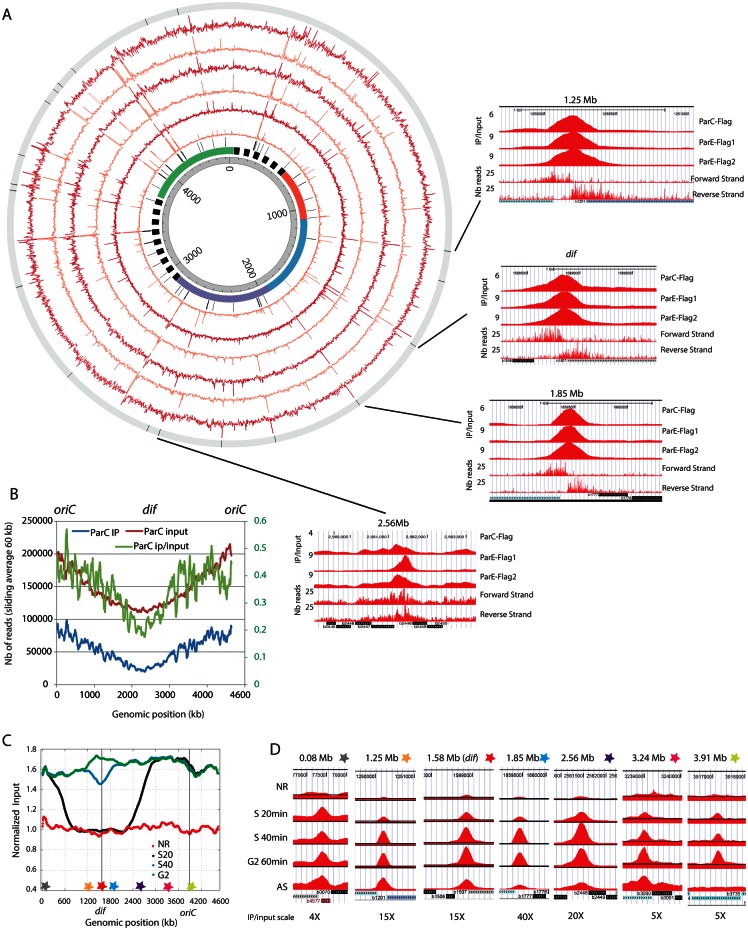
Fig 1. Topo IV binding pattern of replicating chromosome.
A) Circos plot of the ChIP-seq experiments for ParC-flag and ParE-flag. The IP / input ratio over the entire E. coli genome is presented for three independent experiments, one IP on the parC-flag strain and two IPs on the parE-flag strain. From the center to the outside, circles represent: genomic coordinates, macrodomain map, position of tRNA genes and ribosomal operons, ParE-Flag 1 ChIP-seq (untreated data, orange), ParE-Flag 1 ChIP-seq (filtered data, red), ParE-Flag 2 ChIP-seq (untreated data, orange), ParE-Flag 2 ChIP-seq (filtered data, red), ParC-Flag ChIP-seq (untreated data, orange), ParC-Flag ChIP-seq (filtered data, red), position of the 19 validated Topo IV binding sites. The right panels represent magnifications for four specific Topo IV binding sites, position 1.25 Mb, position 1.58 Mb (dif), position 1.85 Mb and position 2.56Mb. The three first rows correspond to filtered IP/Input ratio for ParC-Flag, ParE-Flag1 and ParE-Flag2 IPs, the fourth and fifth rows correspond respectively to the forward and reverse raw read numbers of the parC-flag experiment. The position and orientation of genes are illustrated at the bottom of each panel. B) Sliding averages of the IP (blue, left Y axis), Input (red, left Y axis) and IP/input (green, right Y axis) data for the parC-flag experiment over 60 kb regions along the genome. To facilitate the reading, oriC is positioned at 0 and 4.639 Mb. C) Analysis of Topo IV binding during the bacterial cell cycle. Marker frequency analysis was used to demonstrate the synchrony of the population at each time point. Stars represent the position of the selected Topo IV sites. D) IP/input ratio for 7 regions presenting specific Topo IV enrichment during S and G2 phases. For each genomic position the maximum scale is set to the maximum IP/Input ratio observed.

