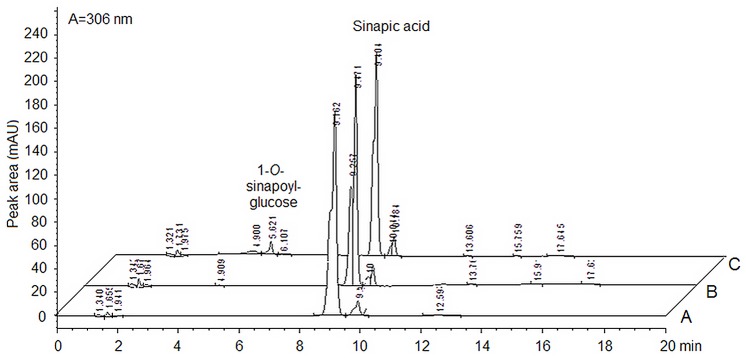
Fig 4. Chromatograms of product formation by the purified enzyme of UDP-glucose: sinapic acid glucosyltransferase in carrots by HPLC.
Peak area A represents the reaction mix without enzyme as the blank control. Peak area B represents the reaction volume with deactivated enzyme. Peak area C represents the reaction system with active enzyme. The retention time of the product: 1-O-sinapoyl-glucose was about 5.6 min, and the peaks for sinapic acid were 9.1 min in average.

