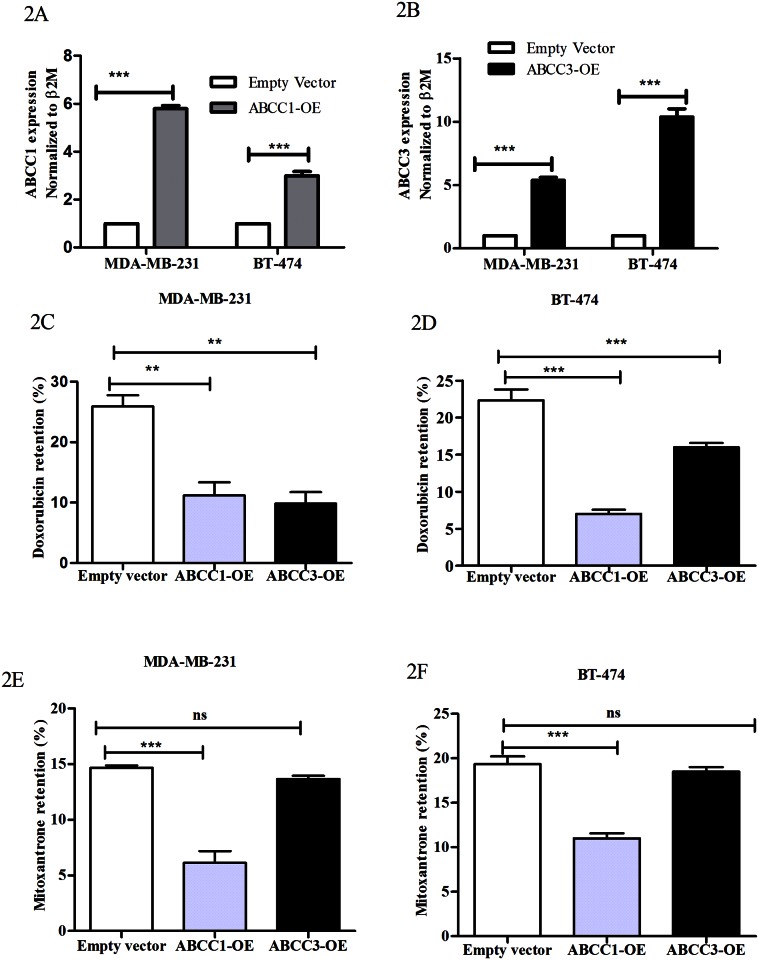
Fig 2. ABCC3 overexpression decreases the retention of anti-cancer agents.
A and B) Bar graphs shows ABCC1 (2A) and ABCC3 (2B) gene expression in MDA-MB-231and BT-474 cells transiently transfected with pCMV (empty vector) or pCMV-ABCC1 overexpression vector (ABCC1 (OE)) or pCMV-ABCC3 overexpression vector (ABCC3 (OE)) of, evaluated by qPCR. Error bar represent standard error of the mean (SEM); *** = p<0.001, n = 3. C) Bar graphs shows the doxorubicin retention (%) in MDA-MB-231, transiently transfected with empty vector (MFI-18±1) or ABCC1 (OE), MFI-13±0.6 or ABCC3 (OE), MFI-13.5±1 and analyzed by flow cytometry. Error bar represent standard error of the mean (SEM); ** = p<0.01, *** = p<0.001, n = 3. D) Bar graphs shows the doxorubicin retention (%) in BT-474 transiently transfected with empty vector (MFI-20±1.2) or ABCC1 (OE). MFI-13.1±0.6 or ABCC3 (OE), 15±0.7 and analyzed by flow cytometry. Error bar represent standard error of the mean (SEM); ** = p<0.01, *** = p<0.001, n = 3. E) Bar graphs shows the mitoxantrone retention (%) in MDA-MB-231 transiently transfected with empty vector, MFI-19.6±0.2 or ABCC1 (OE), MFI-15.3±0.4 or ABCC3 (OE), MFI-18.1±0.67 and analyzed by flow cytometry. Error bar represent standard error of the mean (SEM); *** = p<0.001, n = 3. F) Bar graphs shows the mitoxantrone retention (%) in BT-474 transiently transfected with empty vector, MFI-21.6±0.4 or ABCC1 (OE), MFI-14.3±0.4 or ABCC3 (OE), MFI-19.1±0.97 and analyzed by flow cytometry. Error bar represent standard error of the mean (SEM); *** = p<0.001, n = 3.

