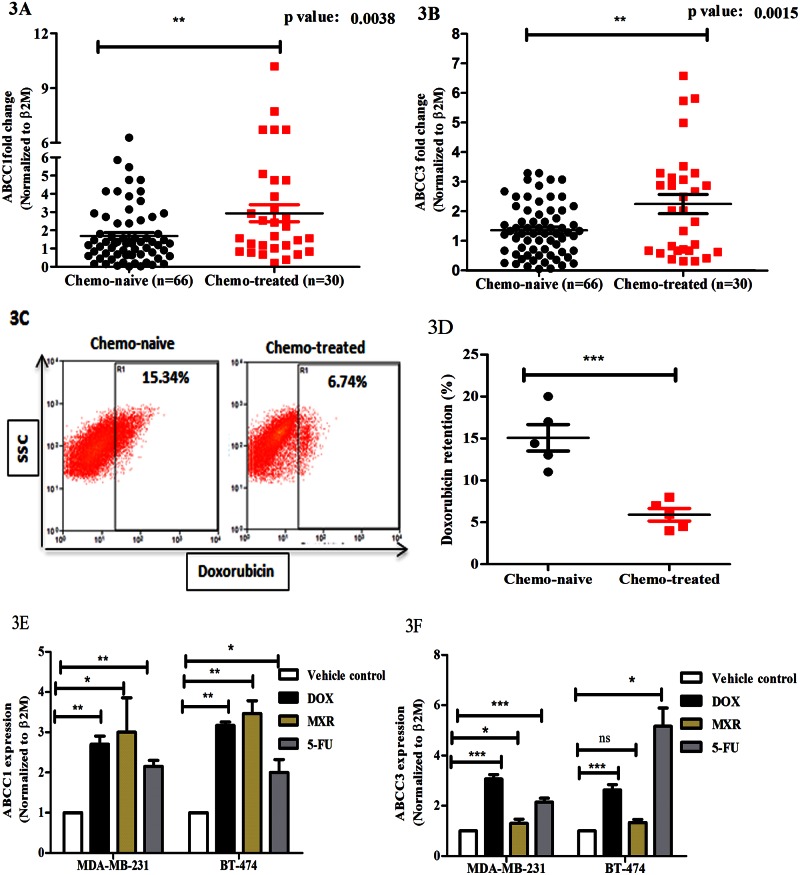
Fig 3. Chemotherapy increases ABCC3 gene expression.
A and B) qPCR analysis of ABCC1 and ABCC3 expression in tumor (chemo-naive) tissues (n = 66) and chemo-therapy treated patient tissue samples (n = 30). Relative quantification of ABCC1 (3A) and ABCC3 (3B) mRNA expression was standardized to β2M housekeeping gene and normalized to chemo-naïve tumor tissue expression. Error bar represent standard error of the mean (SEM); * = p<0.05, ** = p<0.01. C and D) FACS plots (3C) shows the doxorubicin retention in chemo-naive tumour derived cells (n = 5, MFI-9.8±0.3) and CT treated tumour derived cells (n = 5, MFI-5.95±0.4). Bar graph (3D) shows the doxorubicin retention (%). Error bar represent standard error of the mean (SEM); ** = p<0.01, n = 3. E and F) Bar graph shows ABCC1 (3E) and ABCC3 (3F) gene expression in MDA-MB-231 and BT-474 cells treated with vehicle control, doxorubicin (0.25 μM), mitoxantrone (0.25 μM) and 5-FU (3 μM) evaluated by qPCR. Error bar represent standard error of the mean (SEM); * = p<0.05, ** = p<0.01, *** = p<0.001, n = 3.

