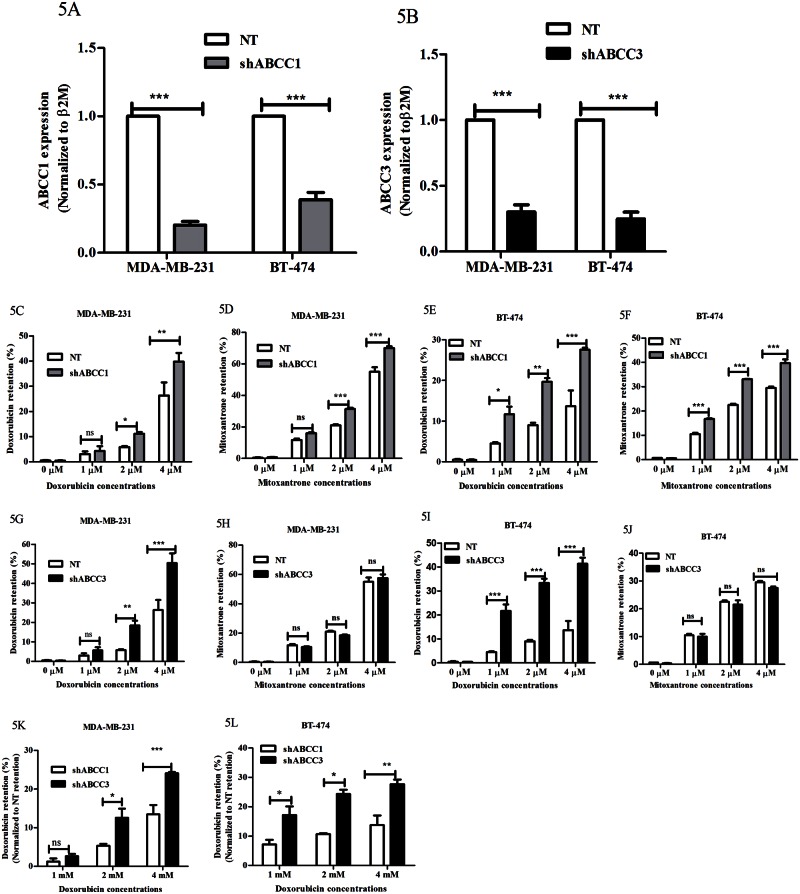
Fig 5. Knockdown of ABCC3 enhances doxorubicin retention in breast cancer cells.
A and B) Bar graph shows ABCC1 (5A) and ABCC3 (5B) gene expression in MDA-MB-231 and BT-74 cells stably expressing non-targeting shRNA (NT), shABCC1 or shABCC3 shRNA evaluated by qPCR. Error bar represent standard error of the mean (SEM); *** = p<0.001, n = 3. C, D, E and F) Bar graphs shows the drug retention (%) in MDA-MB-231 and BT-474 cells stably expressing NT or shABCC1 treated with increasing concentrations of doxorubicin or mitoxantrone. Error bar represent standard error of the mean (SEM); ** = p<0.01, *** = p<0.001, n = 3. G, H, I and J) Bar graphs shows the drug retention (%) in MDA-MB-231 and BT-474 cells stably expressing NT or shABCC3 treated with increasing concentrations of doxorubicin or mitoxantrone. Error bar represent standard error of the mean (SEM); ** = p<0.01, *** = p<0.001, n = 3. K and L) Bar graphs show percentage drug retention in MDA-MB-231 and BT-474 cells stably expressing shABCC1 or shABCC3 and treated with increasing concentrations of doxorubicin. Error bar represent standard error of the mean (SEM); * = p<0.05, ** = p<0.01, *** = p<0.001, n = 3.

