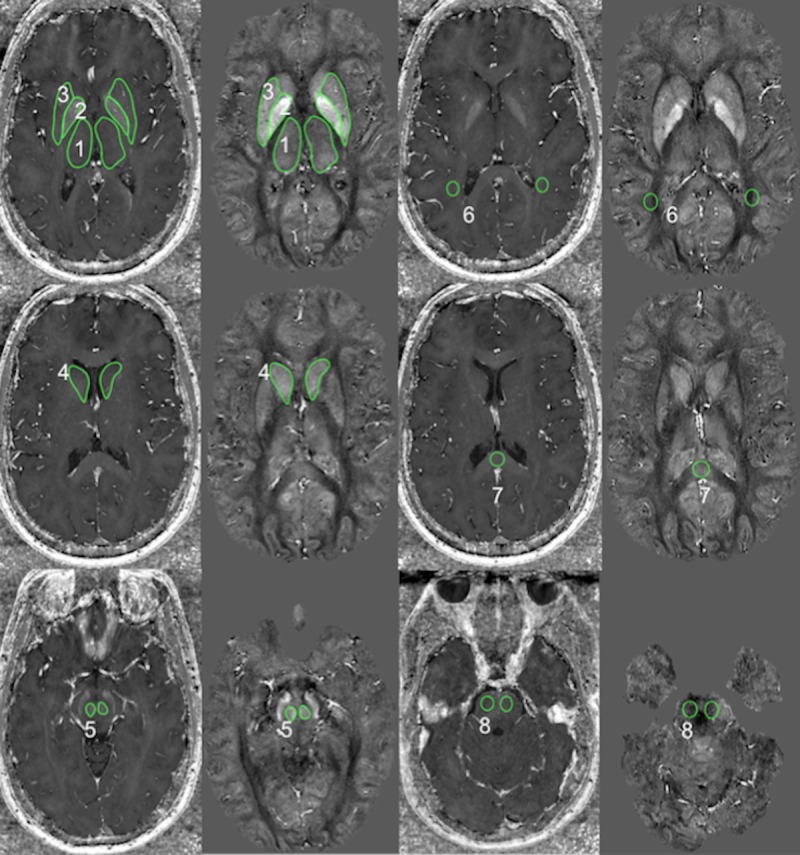
Fig 1. Regions of interest in several cerebral regions.

ROIs (green) laid over relaxation rate map and quantitative susceptibility map. Outlined areas included 1: thalamus, 2: globus pallidus, 3: putamen, 4 caudate, 5: red nucleus, 6: optic radiations, 7: corpus callosum, 8: pons. The contrast (black to white) of the relaxation maps ranges from 0 to 80 s-1 and of the susceptibility map from -0.096 to 0.186 ppb (relative to the whole brain average).
