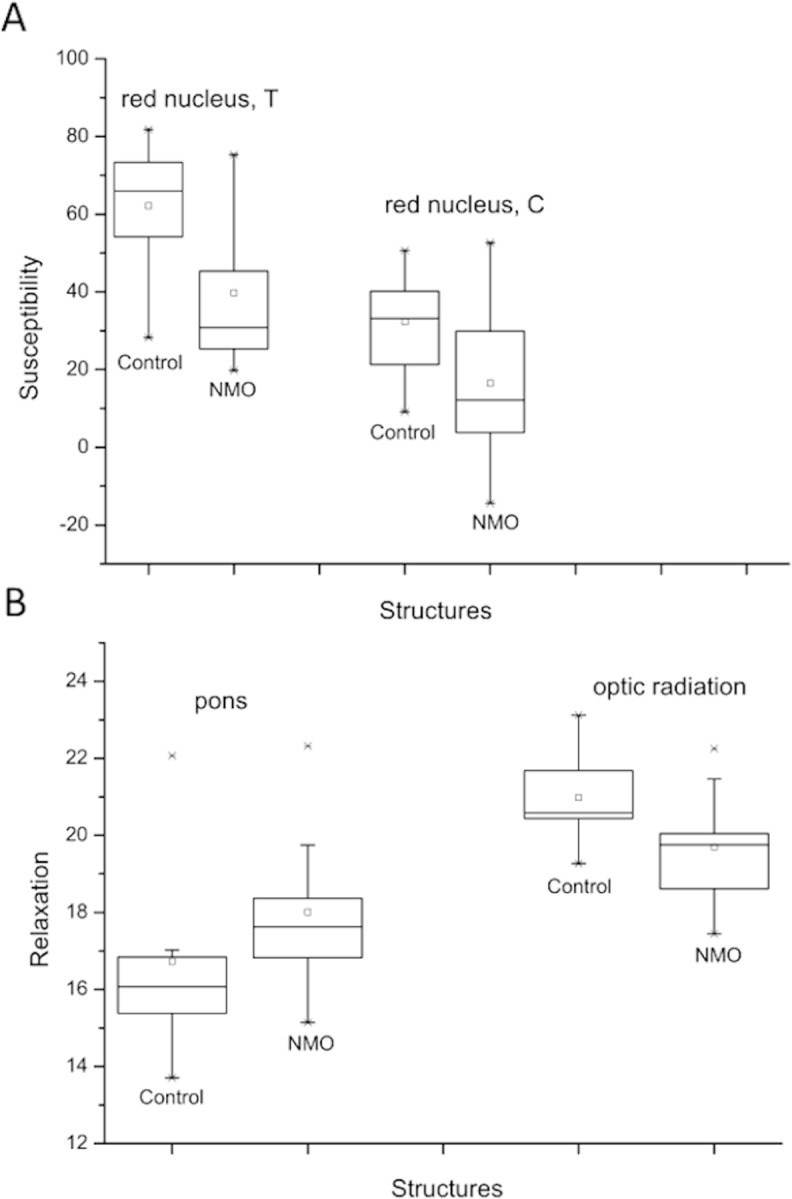
Fig 2. Boxplot.

Boxplot of Susceptibilities (A; in ppb) and relaxations (B; in s-1) of controls and patients with significant alterations are represented.

Boxplot of Susceptibilities (A; in ppb) and relaxations (B; in s-1) of controls and patients with significant alterations are represented.