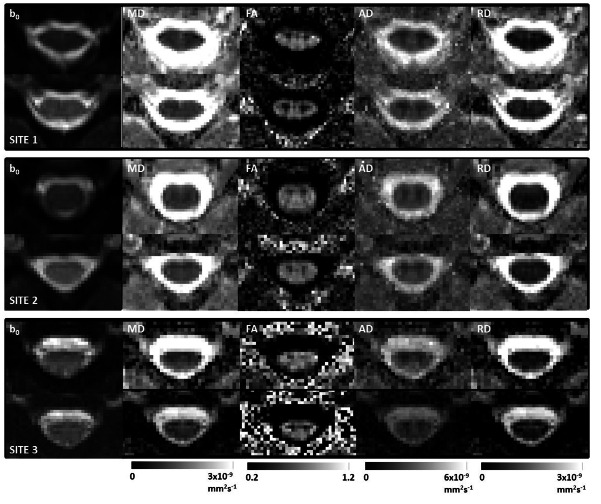
Fig 3. Single subject central slice parameter maps for both protocols acquired at sites 1, 2 and 3 (London, Vanderbilt and Montreal) respectively from top to bottom (for the same subjects as in Figs 1 and 2, but as before not the same subject at each fo the three sites).
For each figure the images from left to right are: mean b0, MD, FA, AD and RD, with images acquired using the OVS protocol on top and the rFOV implementation at the bottom, and associated colour bars given underneath.

