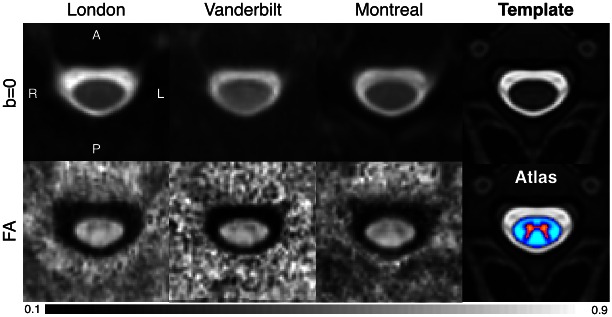
Fig 4. Results of registration to the MNI-Poly-AMU template and group averaging (N = 5; different subjects were scanned at each site) for sites 1 (London), 2 (Vanderbilt) and 3 (Montreal) (b = 0 images are shown in the top row, and FA maps in the bottom).
The 4th column shows the T2-weighted template (top) and the white/grey matter probabilistic atlas (bottom).

