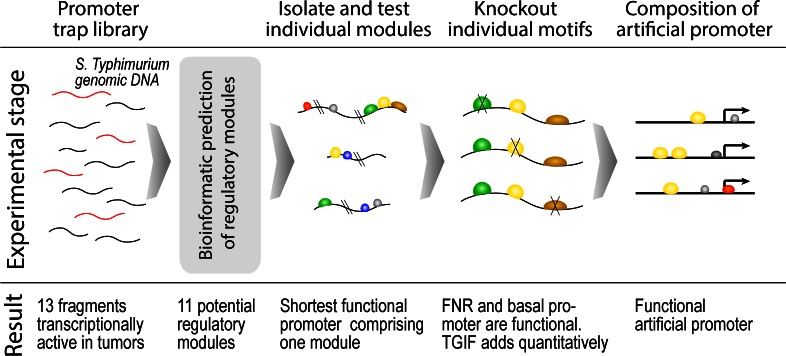
Fig 1. Identification and analysis steps of tumor specific promoters.
A schematic overview. Two programs for basal promoter recognition, one based on sequence alignment kernel [11] and another on Hidden Markov Model (HMM) [12] were applied to the TSP set (DNA sequences are given in the S1 Text). As a negative control, a set of DNA fragments that do not initiate expression either in tumor or in spleen was selected (negative promoters, NP). Both programs recognize potential promoters in either dataset and the number of predictions greatly depends on user-defined threshold parameters. To evaluate the specificity of predictions, it was assumed that a basal promoter should be recognized in at least 75% of TSP and at most 50% of NPs (see Methods). This will ensure the generality and specificity of the recognized feature.

