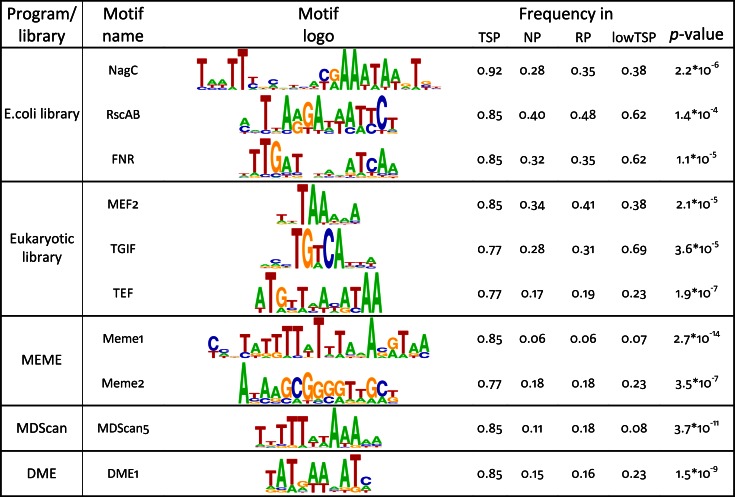
Fig 2. Top motifs identified in the set of tumor specific promoters and its distribution within different groups of promoters.
Values are normalized numbers of promoters in a set containing at least one motif. P-values were calculated as a binomial probability to observe the actual number of promoters with a motif in the TSP set compared to RP set. A potential overfitting effect of prediction methods can be estimated using an independent lowTSP set (see Methods).

