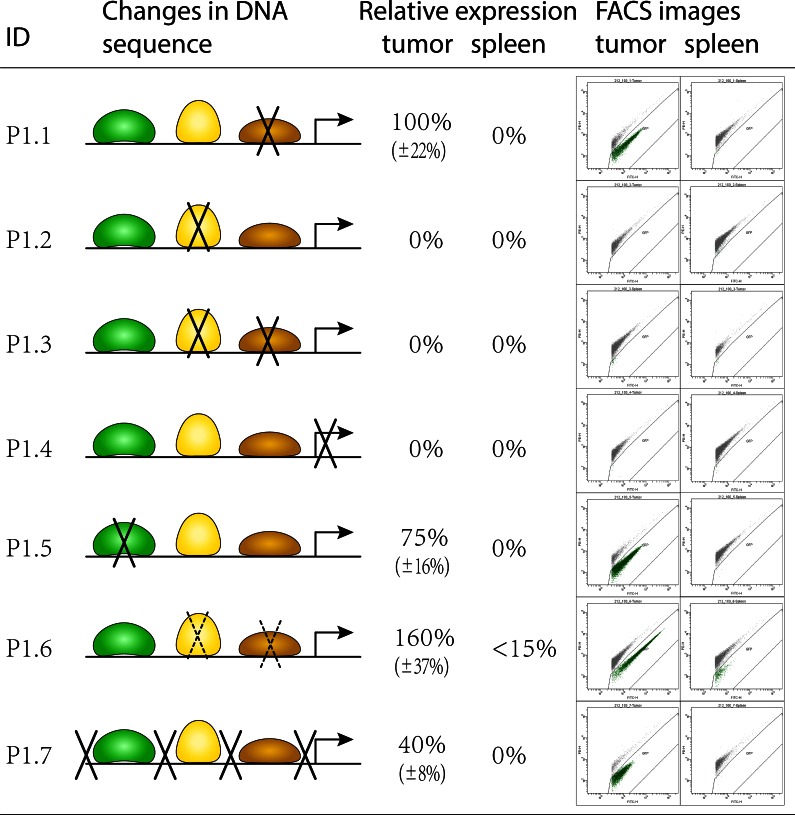
Fig 3. Schematic representation of promoter structure.
Left: binding motifs for factors TGIF, FNR and NagC are shown in green, yellow and brown, respectively. Basal promoter is shown as a directed arrow. Knockout of essential nucleotides within motifs were according to the literature and are represented by crossing lines. Mutation of non-essential nucleotides within motifs was random and is represented by dashed crossing lines. Nucleotides outside motifs were mutated randomly. Right: representative flow-cytometric analyses of GFP-expression in tumor and spleen. Each green point on the blots represents GFP expression levels of an individual bacterial cell. Displayed values of expression are relative to the expression values of the original promoter P0.212_1. All nucleotide substitutions are presented in the S2 Fig.

