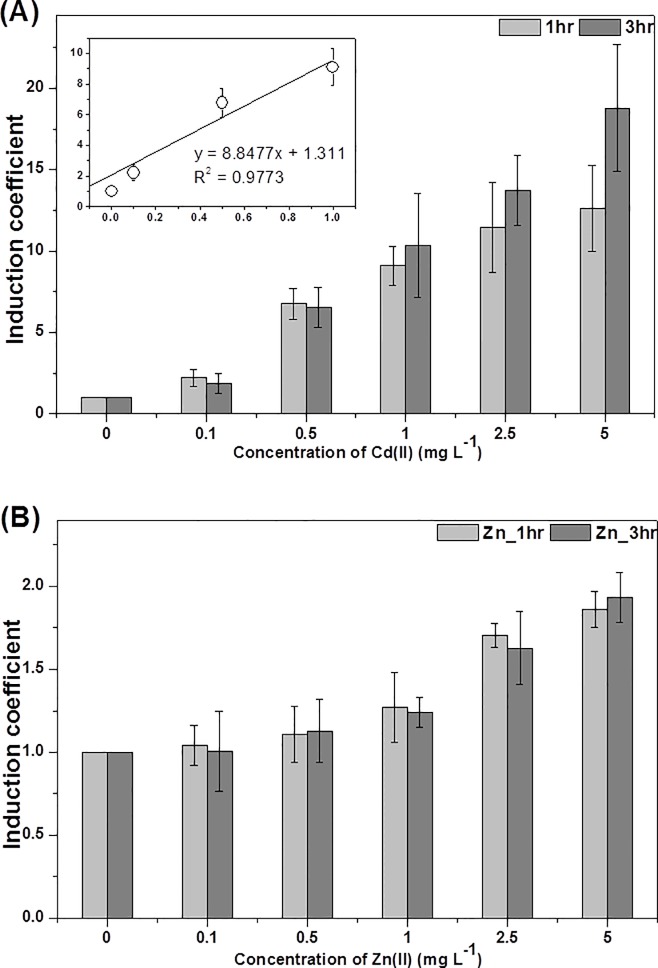
Fig 3. The responses WCBs harboring pZnt-eGFP exposed to different concentrations of Cd(II) and Zn(II) ions during 1 h (grey) and 3 h (dark grey) exposures.
(A) The induction coefficients of WCBs increased as a function of Cd(II) ranging from 0–5 mg/L and it was fit well by linear regression with R2 = 0.9773 for Cd(II) ranging from 0–1 mg/L from 1 h exposure (inset). (B) The induction coefficients for WCBs exposed to Zn(II) ranging from 0–5 mg/L. The data are the mean values of three replicates with the standard deviations.

