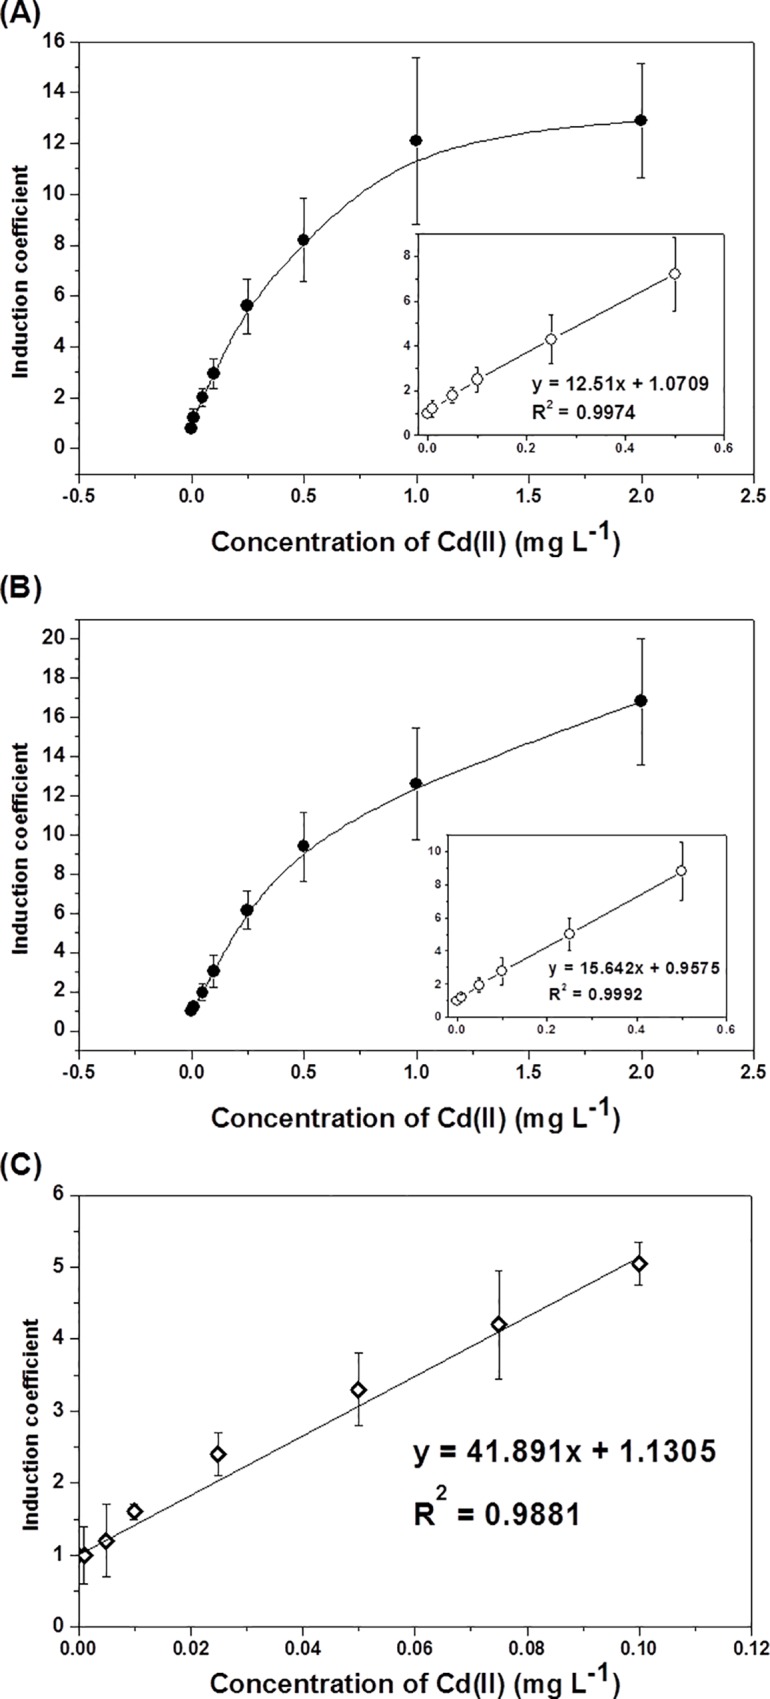
Fig 5.

Standard curves for quantifying bioavailable cadmium in contaminated soils using the in vivo assay for soils (A), in vitro assay for soils (B), and in vivo assay for soil solutions (C). The insets in (A) and (B) show the equation for the linear regression for quantification of Cd(II) ranging from 0–0.5 mg/L. The data are the mean values of more than three replicates with the standard deviations.
