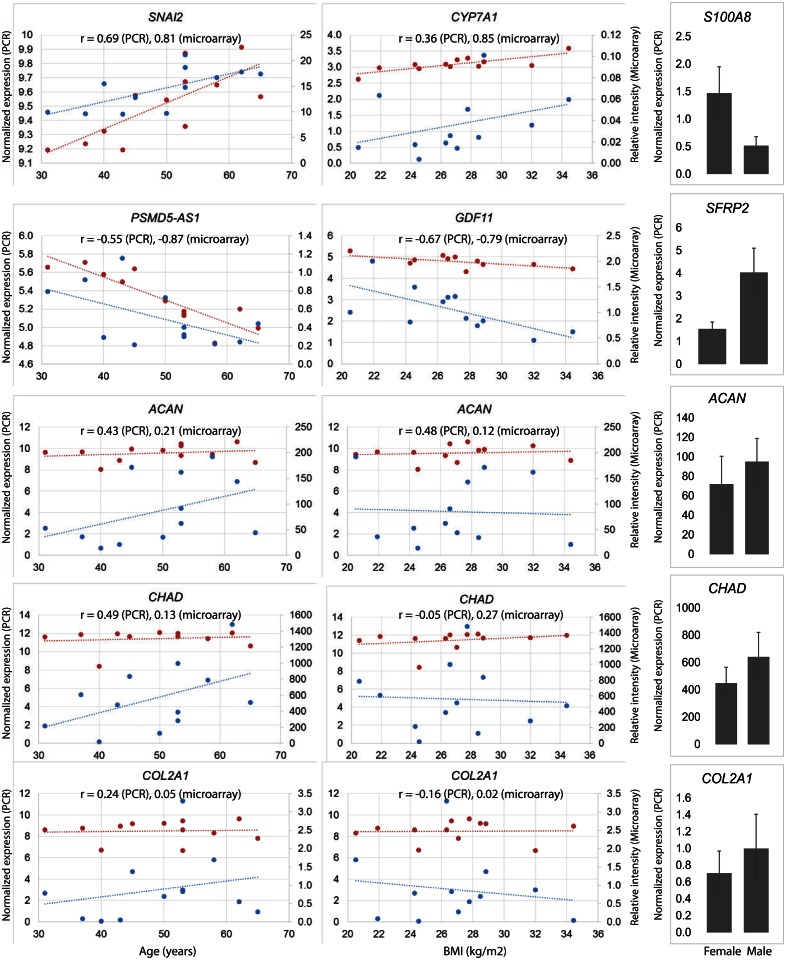
Fig 7. Findings from microfluidic digital PCR and comparison with microarray for selected gene transcripts.
The expression of six differentially expressed gene transcripts was validated by microfluidic-based digital PCR. The expression profile of the entire set of gene transcripts obtained from TaqMan digital PCR assay was concordant with the microarray data. Pearson correlation coefficient was calculated for age (left panel; red microarray, blue digital PCR), and BMI (center panel; red microarray, blue digital PCR) and differential expression was presented for sex (right panel; these data are presented as mean with standard error of the mean). r = correlation coefficient

