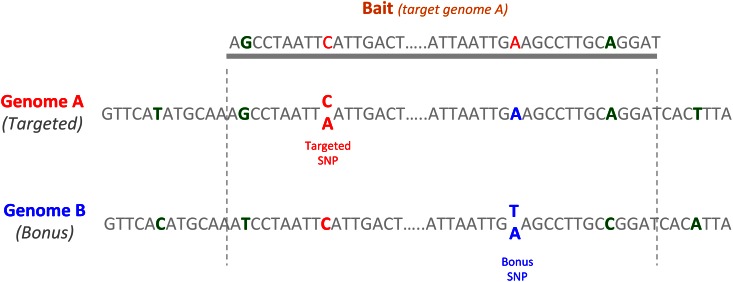
Fig 2. Detection of a bonus SNP on the homeolog of a targeted contig.
A portion of A and B genomes were represented, with an SNP on the A genome (in red) and an SNP on the B genome (in blue). Divergences between both genomes are represented in green. The bait shown in grey was designed initially to capture a portion of the A genome, but captured also the homeologous portion of the B genome, with the related bonus SNP.

