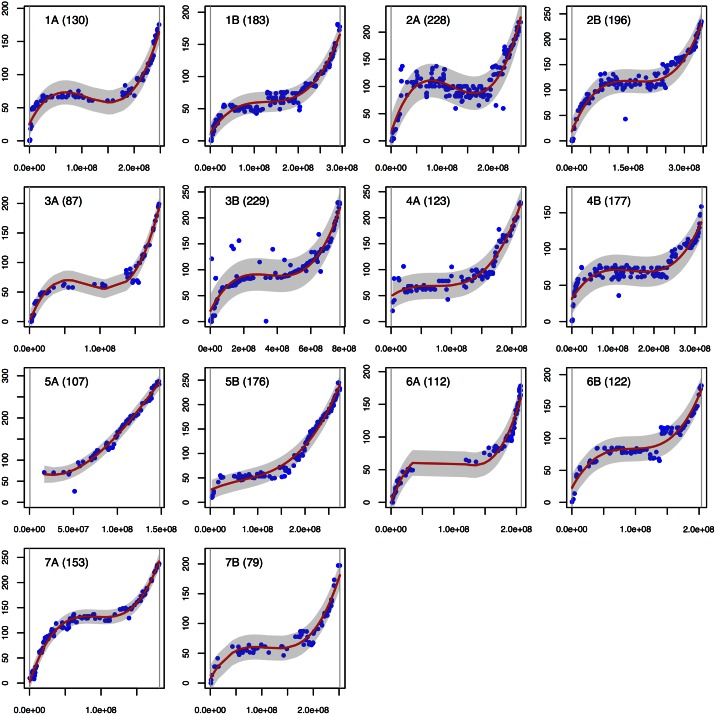
Fig 3. Correlations between putative physical and genetic positions.
The 14 durum wheat chromosomes are shown separately, with the putative physical position on the X-axis (bp) and the genetic position on the Y-axis (cM). The chromosome name is given at the top left of each plot. The number of markers is given in brackets. A red line represents the fitted polynomial model and a grey area represents the 95% confidence interval. The two vertical grey lines are maximum and minimum values of the physical positions.

