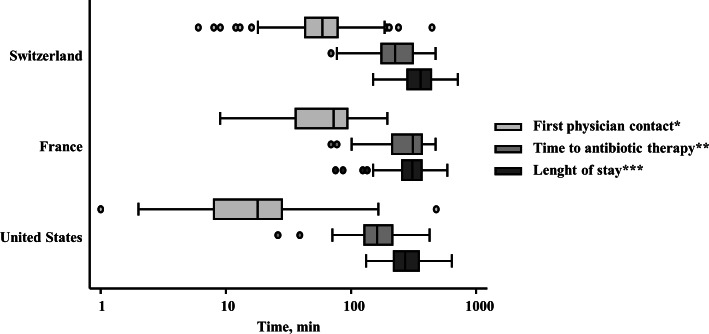
Fig 1. Distribution of ED measures of timely care in patients with acute infections across different countries.
The bottom and top of the box represent the 25th and 75th percentiles of the hospital-reported mean times for that measure, with the middle line representing the median. * Time of arrival to time seen by a doctor. ** Time of arrival to time being given medication. *** Time of arrival to time leaving the emergency department for home or for an in-hospital bed.

