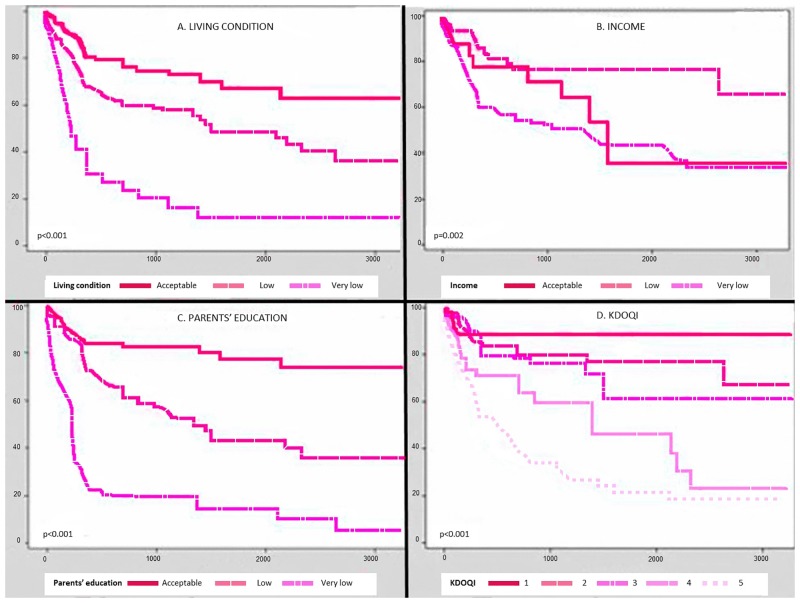
Fig 1. Survival curves.
Owing to the great variability of the characteristics of the cohort (from age, to duration of disease, to disease stage at entry, to the different robustness of the socioeconomic markers), only a fully adjusted multivariable analysis of the whole cohort could provide a synthetic view of the determinants of the combined outcome end-point of the cohort as shown in Table 5.

