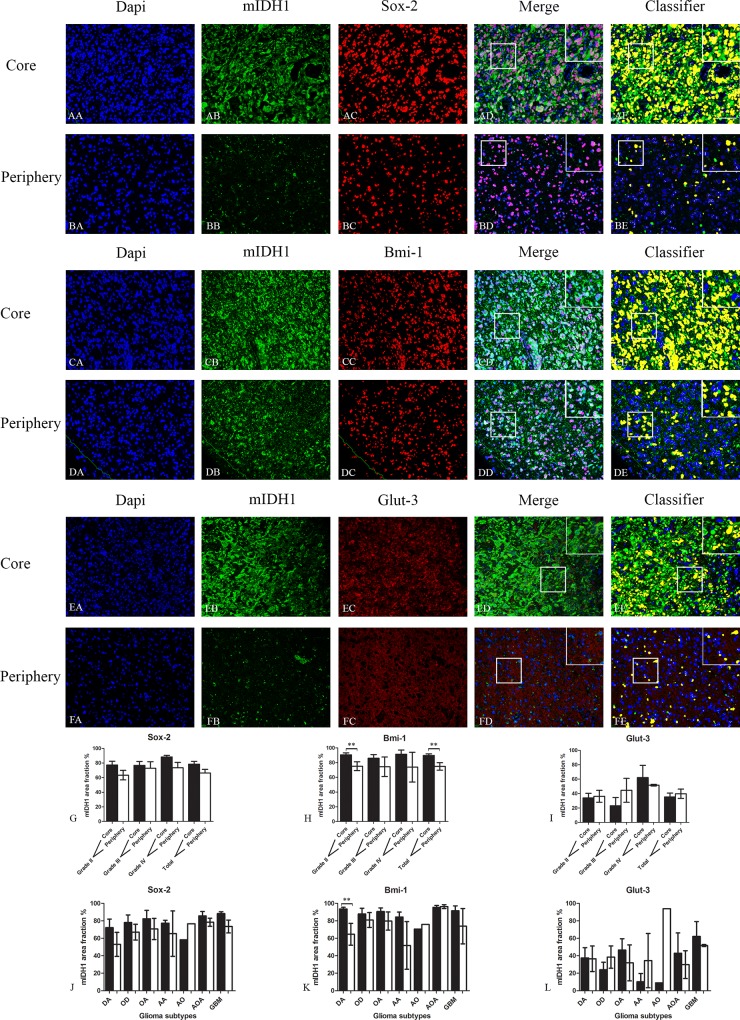
Fig 2. Double immunofluorescence staining of core and periphery of patient glioblastomas.
Histological sections were stained with Dapi (blue), IDH1 (green) and Sox-2 (red) (AA-BE), Bmi-1 (red) (CA-DE) and Glut-3 (red) (EA to FE). The software-based classifier is shown in the right column. The classifier illustrates tumor cells co-expressing markers of interest in yellow and tumor cells not co-expressing markers of interest in green. The fluorescence stainings were quantified in both core and periphery for Sox-2 (G,J), Bmi-1 (H,K) and Glut-3 (I,L). Statistical comparison was performed using student’s t-test and ANOVA, ** p< 0.01. Scalebar: 200μm.

