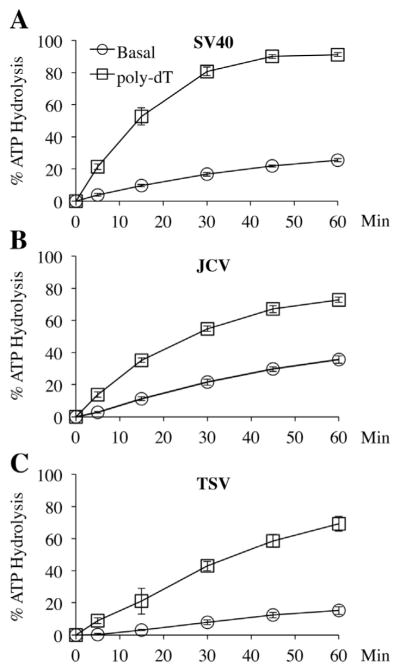
Fig. 3.
Basal and ssDNA-stimulated ATPase activities of Zn-ATPase domains. Percentage of ATP hydrolysis (Y-axis) at various time points (X-axis) were plotted for the basal hydrolysis rate and the rate after addition of poly-dT ssDNA. Each data point was the average of three measurements. The error bars represent standard deviation. Similar results were produced using two independent preparations of each Zn-ATPase. (A) SV40 Zn-ATPase; (B) JCV Zn-ATPase; (C) TSV Zn-ATPase.

