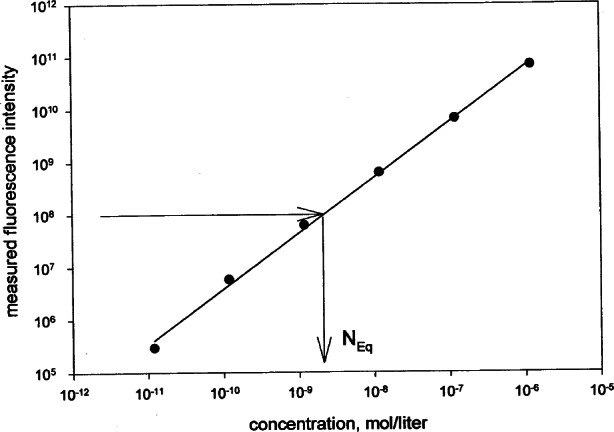
Fig. 3.

A graphical display of the equivalence of fluorescence yields of a microbead suspension and reference fluorophore solution. The straight line is a fit to the six points representing the measured fluorescence radiance in six dilutions of the reference solution. The horizontal arrow points to the measured fluorescence yield of the microbead suspension, and the vertical arrow points to the equivalent concentration of soluble fluorophores.
