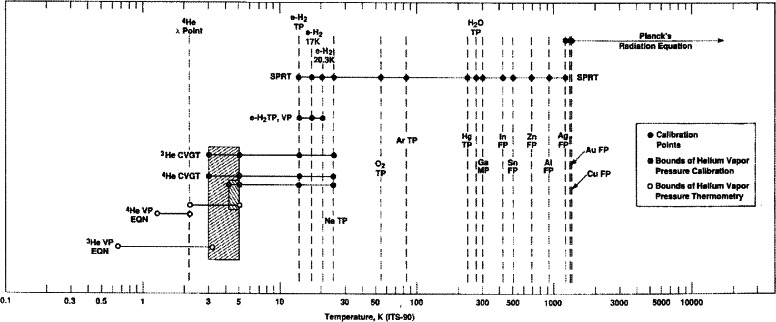
Fig. 2.
A schematic of the ITS-90 showing the temperatures of the defining fixed points (or phase equilibrium states) on the scale and the temperature ranges defined by interpolating instruments and equations. For assigned values of defining temperatures, see Table 1.

