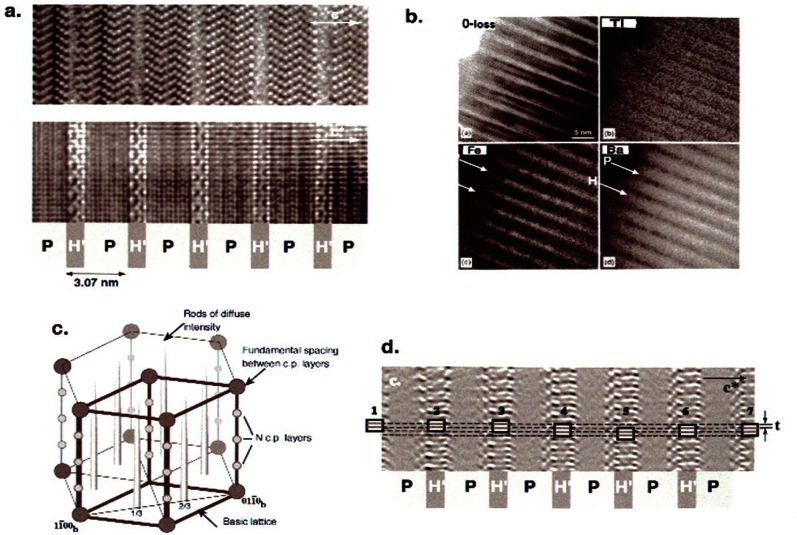
Fig. 8.
(a) HRTEM images of the M phase taken in orientations corresponding to (upper micrograph) and (lower micrograph) zone axes of the hexagonal Ba(Ti,Fe)O3 layer. On the background the yellow and pink stripes correspond to P (perovskite) and H-type (magnetite) slabs, respectively. (b) Composional maps of the M phase (in zone axis orientaion) obtained with Ti L2,3, Ba M4,5, and Fe L2,3 edges. The maps show the Ti composition is relatively uniform throughout the crystals whereas the Fe elemental distribution reveals an enhancement corresponding to the H slabs. Similarly, the Ba distribution is decreased in the H slabs relative to the P slabs. (c) A schematic drawing of a reciprocal lattice of the compounds showing the typical rods of continuous intensity in the c-direction. (d) The image obtained by inverse FFT shows only the H slabs. Rectangles correspond to a characteristic structural element of the H slab and emphasize random shift of the H slabs.

