
Fig. 9.
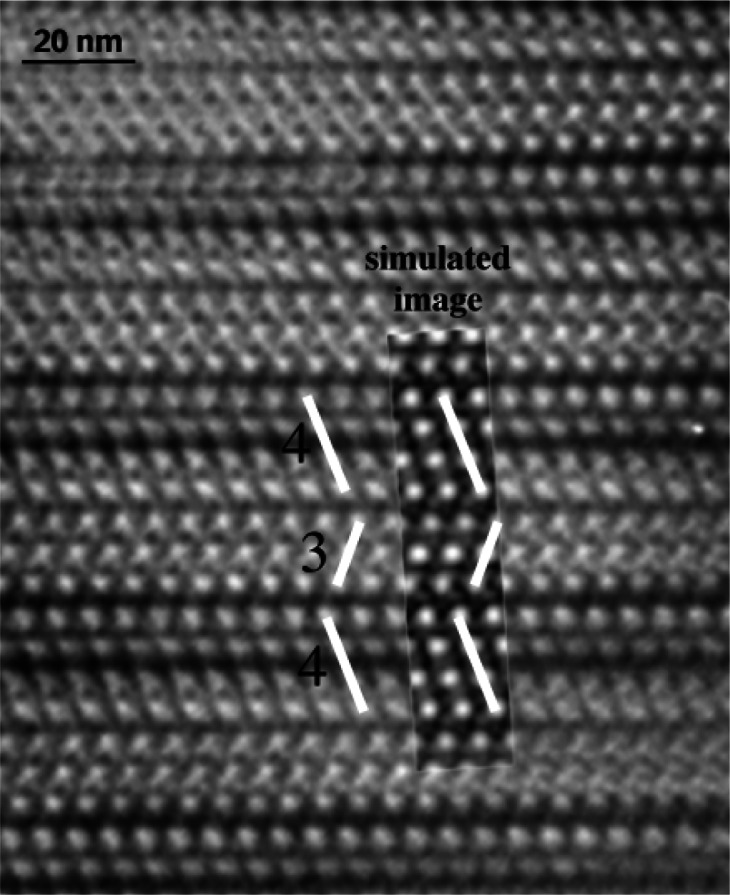
High-resolution TEM image for 7M-Ca2Ta2O7 viewed along [110] and the corresponding simulated phase-contrast image (inset). The simulated image was obtained for 35 nm thickness, −50 nm defocus value and the 10 nm−1 aperture. The 4- and 3-layers structural blocks are emphasized.