FIGURE 3:
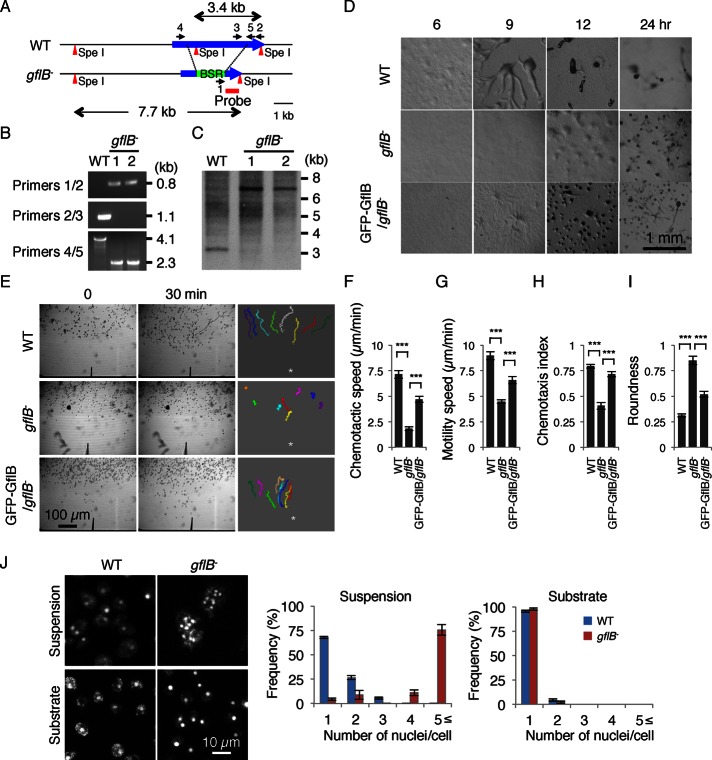
gflB− cells are defective in chemotaxis. (A) The gflB was replaced by a blasticidin resistance cassette (BSR). (B) Genomic DNA was analyzed by PCR with primer sets 1/2, 2/3, and 4/5. The primer set 1/2 amplified a 0.8-kb region in gflB− cells, whereas the primer 2/3 set amplified a 1.1-kb region in WT cells. The primer set 4/5 amplified a 4.1-kb region in WT cells and a 2.3-kb region in gflB− cells. (C) Genomic DNA was digested with the indicated restriction enzymes and analyzed by Southern blotting with a DNA fragment corresponding to the region designated as the probe in A. After digestion with SpeI, a 3.4-kb band was generated from WT cells, whereas a 7.7-kb band was generated from gflB− cells, as expected. (D) WT cells, gflB− cells, and gflB− cells expressing GFP-GflB (GFP-GflB/gflB− cells) were plated on nonnutrient DB agar and examined over time for development. (E) Developed WT cells, gflB− cells, and GFP-GflB/gflB− cells were placed in a chemoattractant gradient generated by a micropipette that releases cAMP and were observed for 20 min by phase contrast microscopy. The cell migration trajectories are shown. The chemotaxis assays were quantified (F–I). (F) Chemotactic speed, calculated as the distance traveled toward the micropipette divided by the elapsed time (20 min). (G) Motility speed, defined as the total distance traveled divided by the elapsed time, determined by measuring the position of a centroid every 30 s for a period of 20 min. (H) Chemotactic index, defined as the distance traveled in the direction of the gradient divided by the total distance traveled in 20 min. (I) Roundness, determined by calculating the ratio of the short axis (As) and long axis (Al) of cells (As/Al). The values represent the mean ± SEM. At least 30 cells were analyzed for each group. (J) DAPI staining shows that gflB− cells are multinucleated when cultured in suspension but not on solid substrates. The nuclei per cell were quantified. Values represent mean ± SEM (n = 30).

