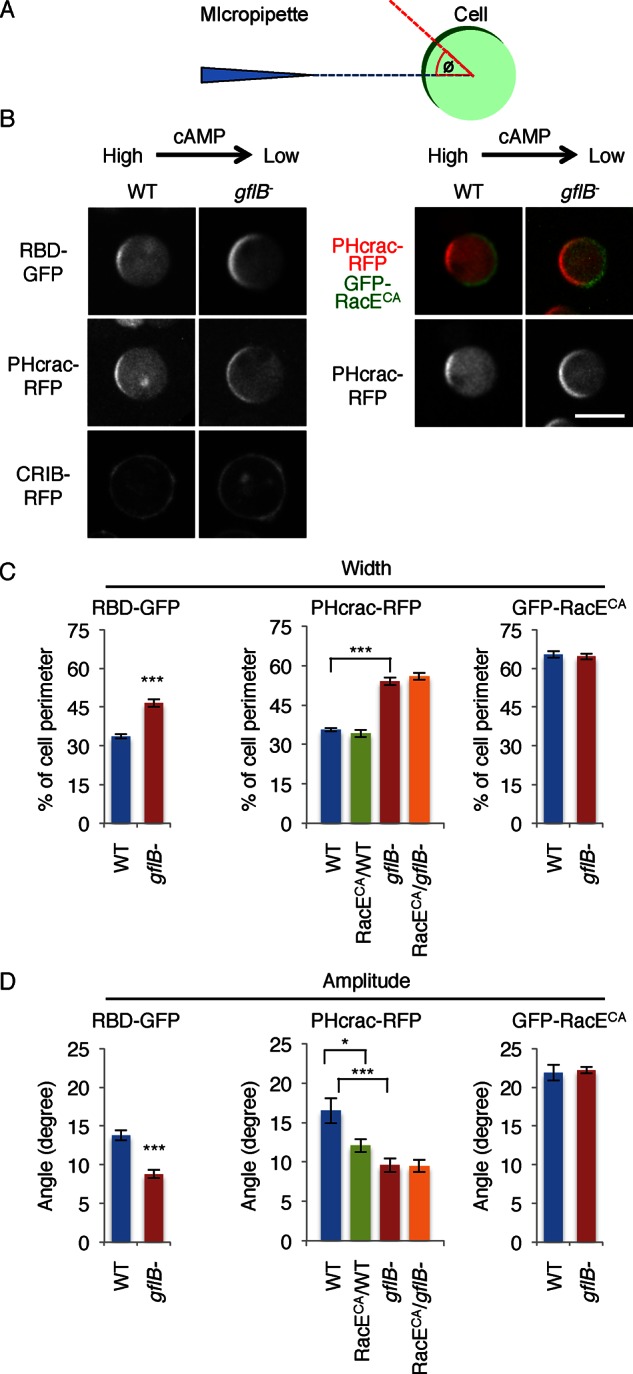
FIGURE 7:

GflB regulates gradient sensing. (A) The gradient-sensing assay. Cells expressing biosensors were placed in a cAMP gradient in the presence of latrunculin A. To determine the positions of the PHcrac and RBD crescents, the angle Φ was defined by measuring the angle formed by two lines: the line drawn between the centroid of the cell and the center of the crescent (red), and the line drawn between the centroid of the cell and the tip of the micropipette (blue). The edges of each crescent were defined as the points at which the fluorescence intensity on the membrane was 1.5-fold higher than that in the cytoplasm. (B) WT and gflB− cells expressing RBD-GFP, PHcrac-RFP, or CRIB-RFP were analyzed in the gradient-sensing assay (left). WT and gflB− cells expressing PHcrac-RFP along with GFP-RacEG20V were also analyzed in the gradient-sensing assay (right). GFP-RacEG20V formed a crescent on the side of the cell that faces away from the cAMP gradient (right, green). Images were taken 10–15 min after the cAMP gradient was formed. The cAMP gradient is generated from the right side of cells in each image. (C) The widths of the crescents were quantified. (D) The amplitudes of the lateral movements of the crescents were quantified by calculating the angle Φ as described in A. Values represent the mean ± SEM. More than 30 cells were analyzed for each group.
