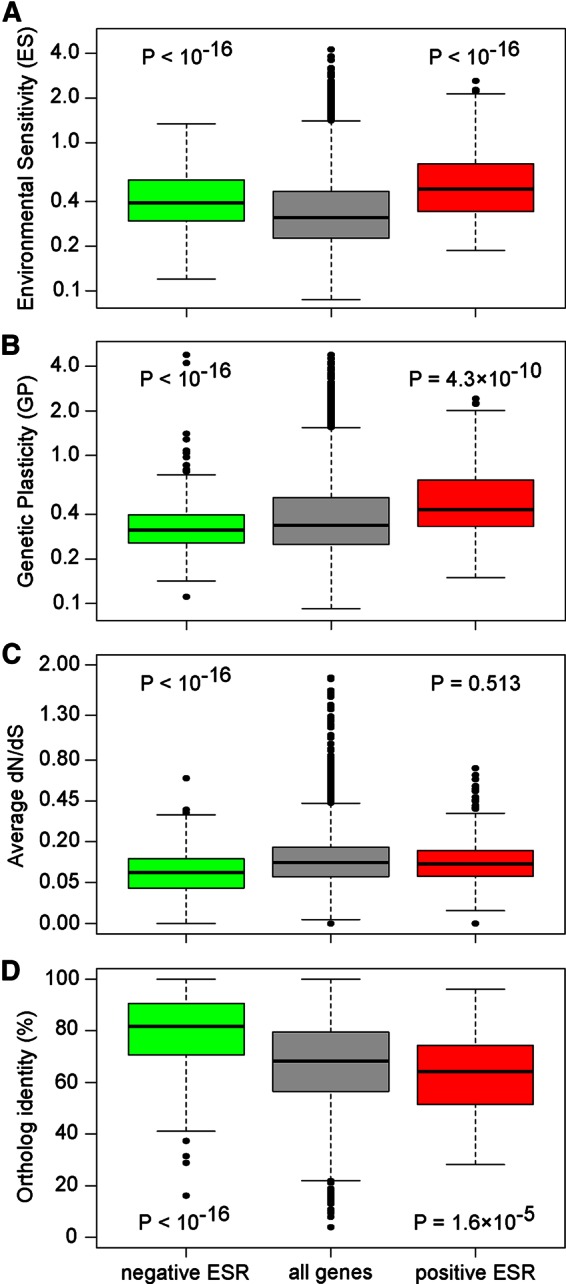
FIGURE 3:

Specific behavior of the ESR genes. Green, negative ESR; red, positive ESR. The p values correspond to a t test compared with all genes. (A) Environmental sensitivity (axis on a log scale). (B) Genetic plasticity (axis on a log scale). (C) Intraspecies protein sequence variation (measured by dN/dS; axis on a square root scale). (D) L. kluyveri–S. cerevisiae protein sequence conservation (percentage of identity).
