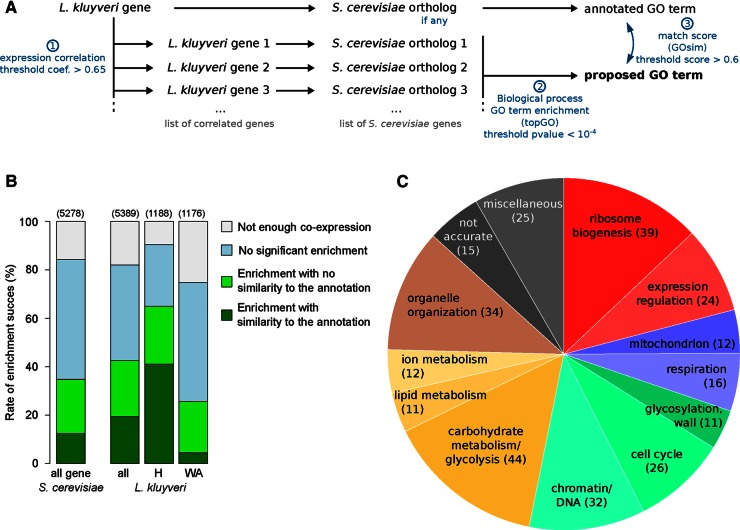
FIGURE 5:
Automated approach to assigning pathways to genes. (A) The three steps of the pipeline for pathway proposal. Steps 2 and 3 are completed using the topGO and GOsim packages of R Bioconductor, respectively. (B) Comparison of the success rates using this approach in S. cerevisiae and L. kluyveri. H, genes highly conserved in L. kluyveri compared with S. cerevisiae. WA, genes weakly annotated, corresponding to genes with few or no similarities to the S. cerevisiae genome. Values in parentheses correspond to the number of genes used for the analysis. (C) Pie chart summarizing the biological process superfamily associated with the assigned GO terms for 301 of the weakly annotated genes.

