. 2016 Apr 11;5:e12845. doi: 10.7554/eLife.12845

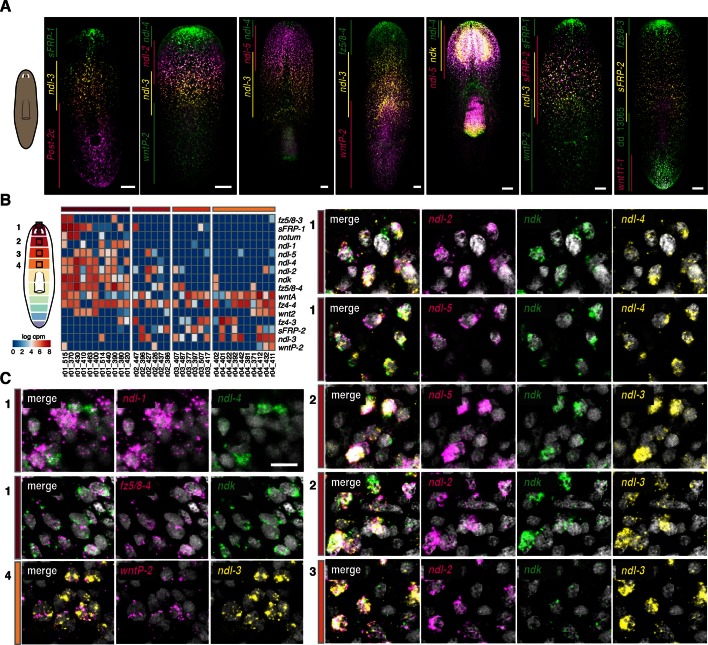
Figure 2. Co-expression of mRGs along the AP axis.

(A) FISH using mRGs maps discrete domains of mRG expression onto the planarian AP axis. Bars on left indicate the approximate extent of the expression domain for each of the genes analyzed. Images are representative of n≥5 animals. Anterior, up. Scale bar, 100 μm. (B) Heatmap shows co-expression of anterior FGFRL and Wnt pathway mRGs in the four anterior regions indicated in the cartoon (1–4). Each column shows expression within a single cell with color bars above indicating the dissected region of origin for the cell. cpm, counts per million (C) FISH using different FGFRL/ndl probes and Wnt pathway mRGs show co-expression in the four regions depicted in the cartoon. Black boxes (1–4) in the cartoon in B show the region imaged for the FISH, as denoted by the number and colored rectangle next to the merged image. Scale bar, 10 μm. Images are representative of n≥5 animals.

DOI: http://dx.doi.org/10.7554/eLife.12845.006

Figure 2.

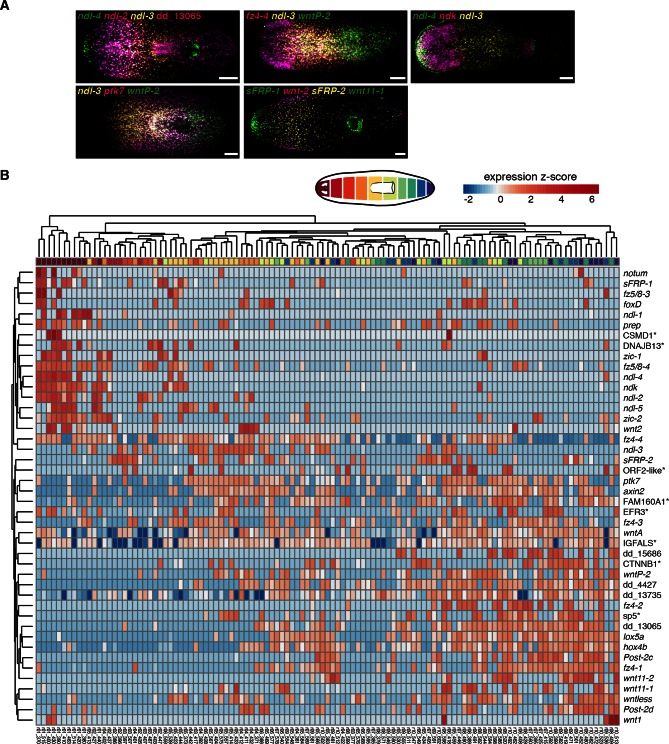
Figure 2—figure supplement 1. Axial mRG map and co-expression of multiple FGFRL genes and mRGs in the same muscle cell.

Figure 2—figure supplement 1.

(A) FISH using a combination of known and new mRG RNA probes show distributions of gradients along the AP axis. Anterior, left. Scale bar, 100 μm. Each image is representative of n>5 animals. (B) Heatmap shows hierarchical clustering of the identified 44 mRGs in each of the 115 muscle cells analyzed. Cartoon on top depicts the 10 regions dissected. Top color bar indicates region of origin for that cell. Expression values for each gene are scaled across each row as z-scores. (*) marks transcripts that are named by best human BLASTx hits.
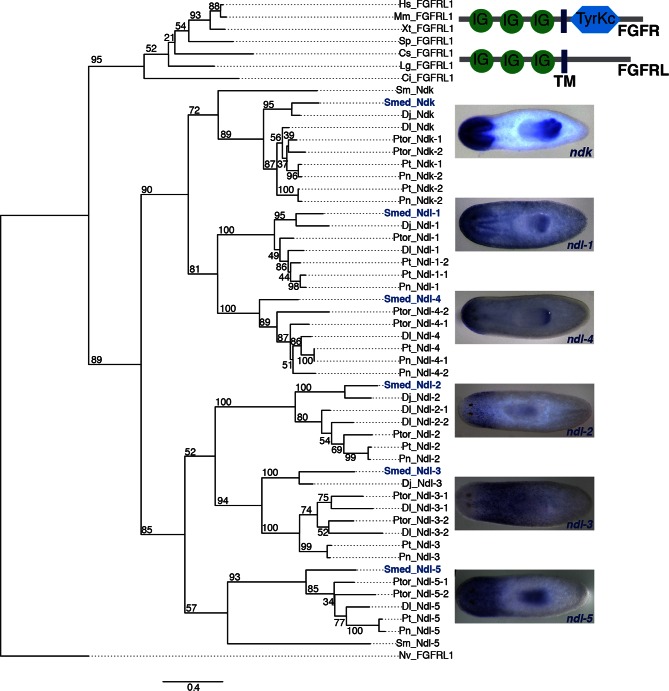
Figure 2—figure supplement 2. Phylogenetic analysis of SMED-FGFRL proteins.

Figure 2—figure supplement 2.

Top right: Domain diagram of FGFR and FGFRL proteins. IG, immunoglobulin domain; TM, transmembrane domain; TyrKc, Tyrosine kinase. Tree showing 54 FGFRL proteins from diverse organisms, which were aligned using MUSCLE with default settings and trimmed with Gblocks. Maximum likelihood analyses were run using PhyML with 100 bootstrap replicates, the WAG model of amino acid substitution, 4 substitution rate categories and the proportion of invariable sites estimated from the dataset. All ML bootstrap values are shown above or below respective branch. Hs, Homo sapiens; Mm, Mus musculus; Xt, Xenopus tropicalis; Sp, Strongylocentrotus purpuratus; Cs, Capitella sp. I; Lg, Lottia gigantean; Ci, Ciona intestinalis; Sm, Schistosoma mansoni; Smed, Schmidtea mediterranea; Dj, Dugesia japonica; Dl, Dendrocoelum lacteum; Ptor, Planaria torva; Pt, Polycelis tenuis; Pn, Polycelis nigra; Nv, Nematostella vectensis. Right, ISH of the 6 Schmidtea mediterranea FGFRL genes shown in tree. Images are representative of n>10 animals. Anterior, left.
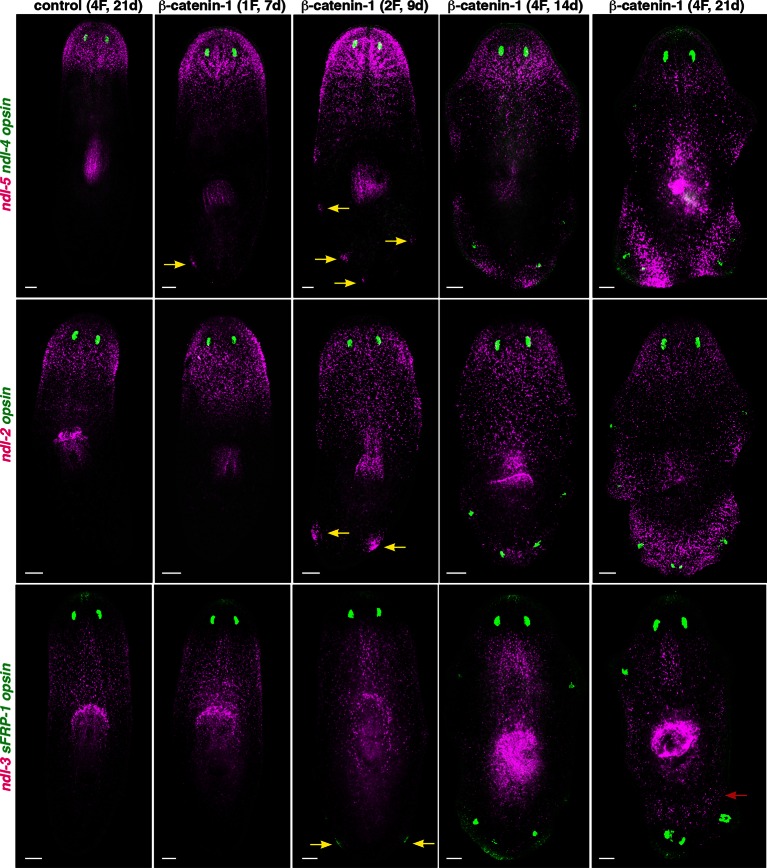
Figure 2—figure supplement 3. Pattern of FGFRL/ndl family expression in β-catenin-1 RNAi animals.

Figure 2—figure supplement 3.

FISH shows expression of ndl-5, ndl-2, ndl-3, and sFRP-1 in control and  β-catenin-1 RNAi animals after one, two, or four RNAi feedings (1F, 2F, 4F). Animals were fixed at different timepoints after initiation of RNAi, shown in brackets at the top. Yellow arrows show ectopic expression of anterior mRGs in posterior regions of the animal before ectopic eyes are visible. Red arrow indicates ectopic expression of the prepharyngeal mRG ndl-3. opsin (green) marks eyes. Anterior, up. Scale bar, 100 μm.
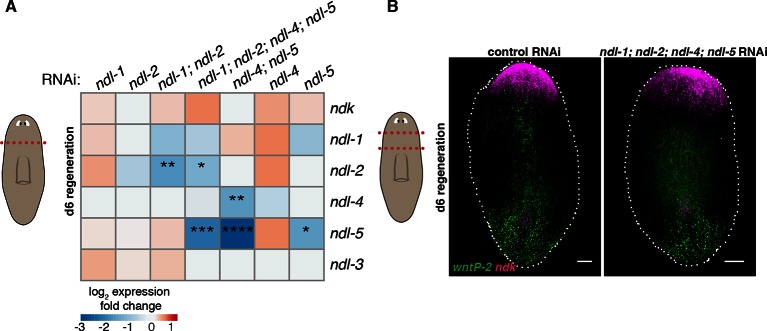
Figure 2—figure supplement 4. Inhibition of FGFRL genes does not significantly change expression of other members of the FGFRL family.

Figure 2—figure supplement 4.

(A) Heatmap shows efficiency of RNAi inhibition in each condition, and no significant effects in the expression level of other genes. Color scale represents mean log2 fold change in expression of each gene (rows) in the RNAi conditions (columns) compared to control RNAi in 6 dpa head fragments (cartoon on left, screen RNAi feeding protocol was used, see Methods). At least three head fragments were analyzed by qRT-PCR in each condition. One-way ANOVA, * p<0.05, ** p<0.01, *** p<0.001, **** p<0.0001. (B) FISH shows normal expression of ndk and wntP-2 in ndl-1; ndl-2; ndl-4; ndl-5 RNAi animals in prepharyngeal fragments 6 dpa (cartoon on left, same RNAi feeding protocol as A). Anterior, up. Scale bar, 100 μm.